
Anglican Church, Darwin, Australia
The Darwin Portfolio is one of my portfolios that I don’t normally adjust too often. It holds 5 ETFs that represent 5 of the major asset classes and allocations are based on Risk Parity such that risk (as measured by volatility) is limited to 3% per ETF. In addition to these 5 ETFs the portfolio holds shares in a Volatility ETF – I consider Volatility to be another asset class and a valuable diversifier. However, I do not include this ETF (SVXY) in my Risk Parity calculations but (arbitrarily) allocate 10% of portfolio value to this asset. More on this later in this post.
Reviewing this portolio at month’s end recommended holdings look like this (Current Shares Required (Risk Parity)):
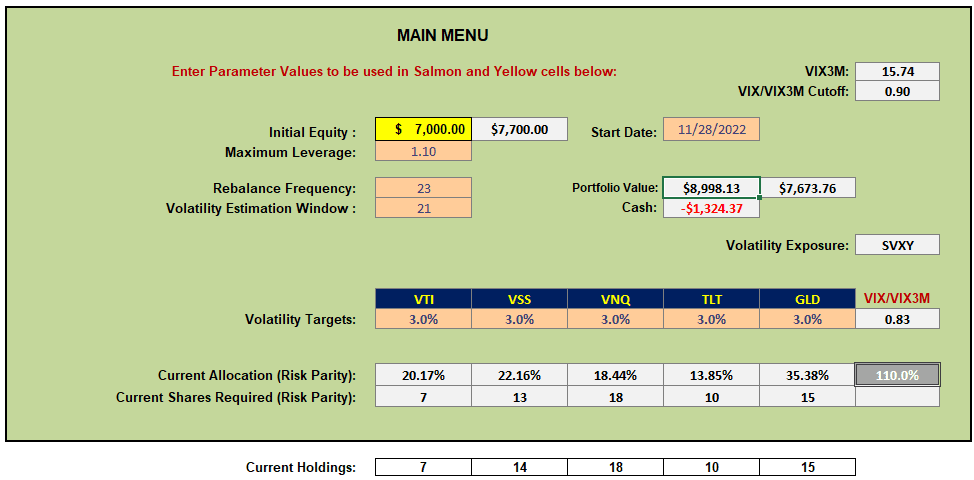
and, although I don’t normally adjust every month unless allocations deviate from recommendations by greater than 20% – and this adjustment was made last month – I have brought everything back into line (with the exception of VSS) because of other considerations as we’ll see below.
Performance of the portfolio to date looks like this:
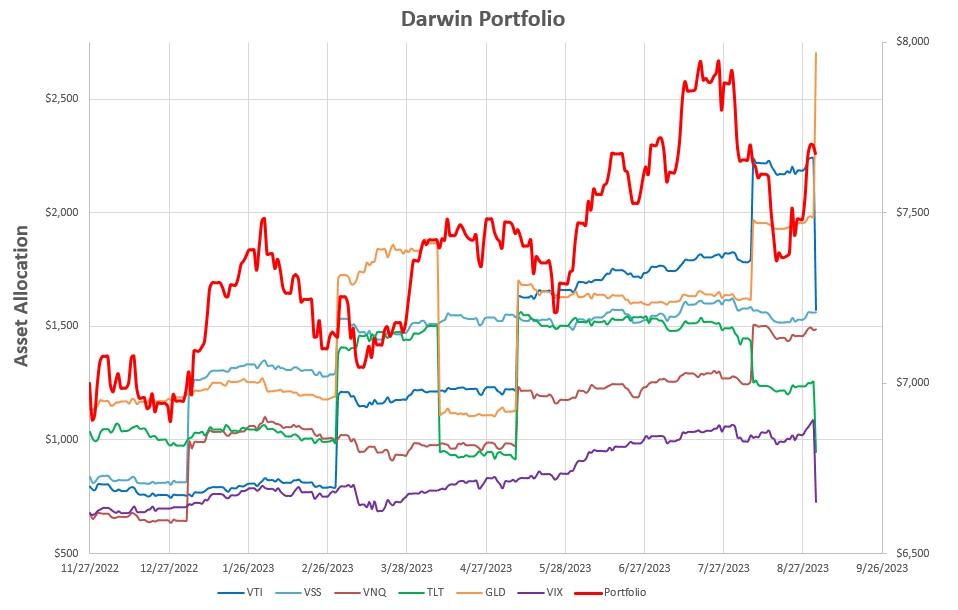 or, in “stacked” format:
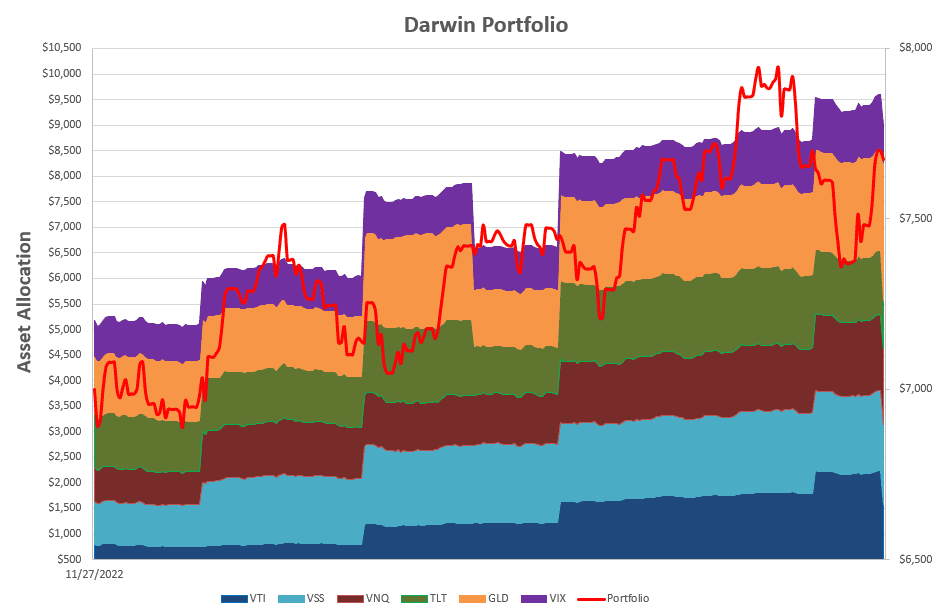 where the discontinuities correspond to allocation adjustments.
Numerically, Internal Rate of Return (IRR) for this portfolio (since inception) is running at 14.46%:
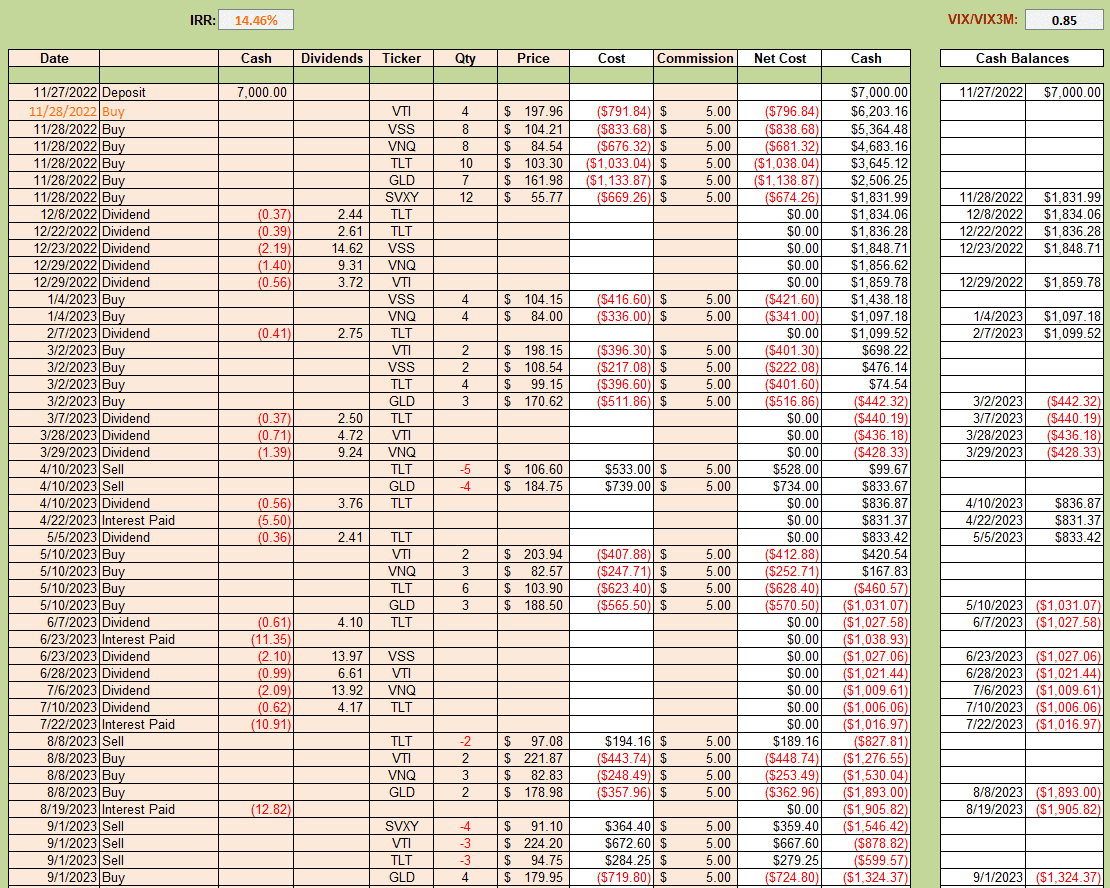 and this month’s adjustments can be seen in the last 4 rows of the above table.
The major adjustment this month was my decision to sell 4 shares of SVXY (the Volatility ETF) and the reason for this is that the 12 share holding represented ~17% of total portfolio value due to the performance seen in the following screenshot:
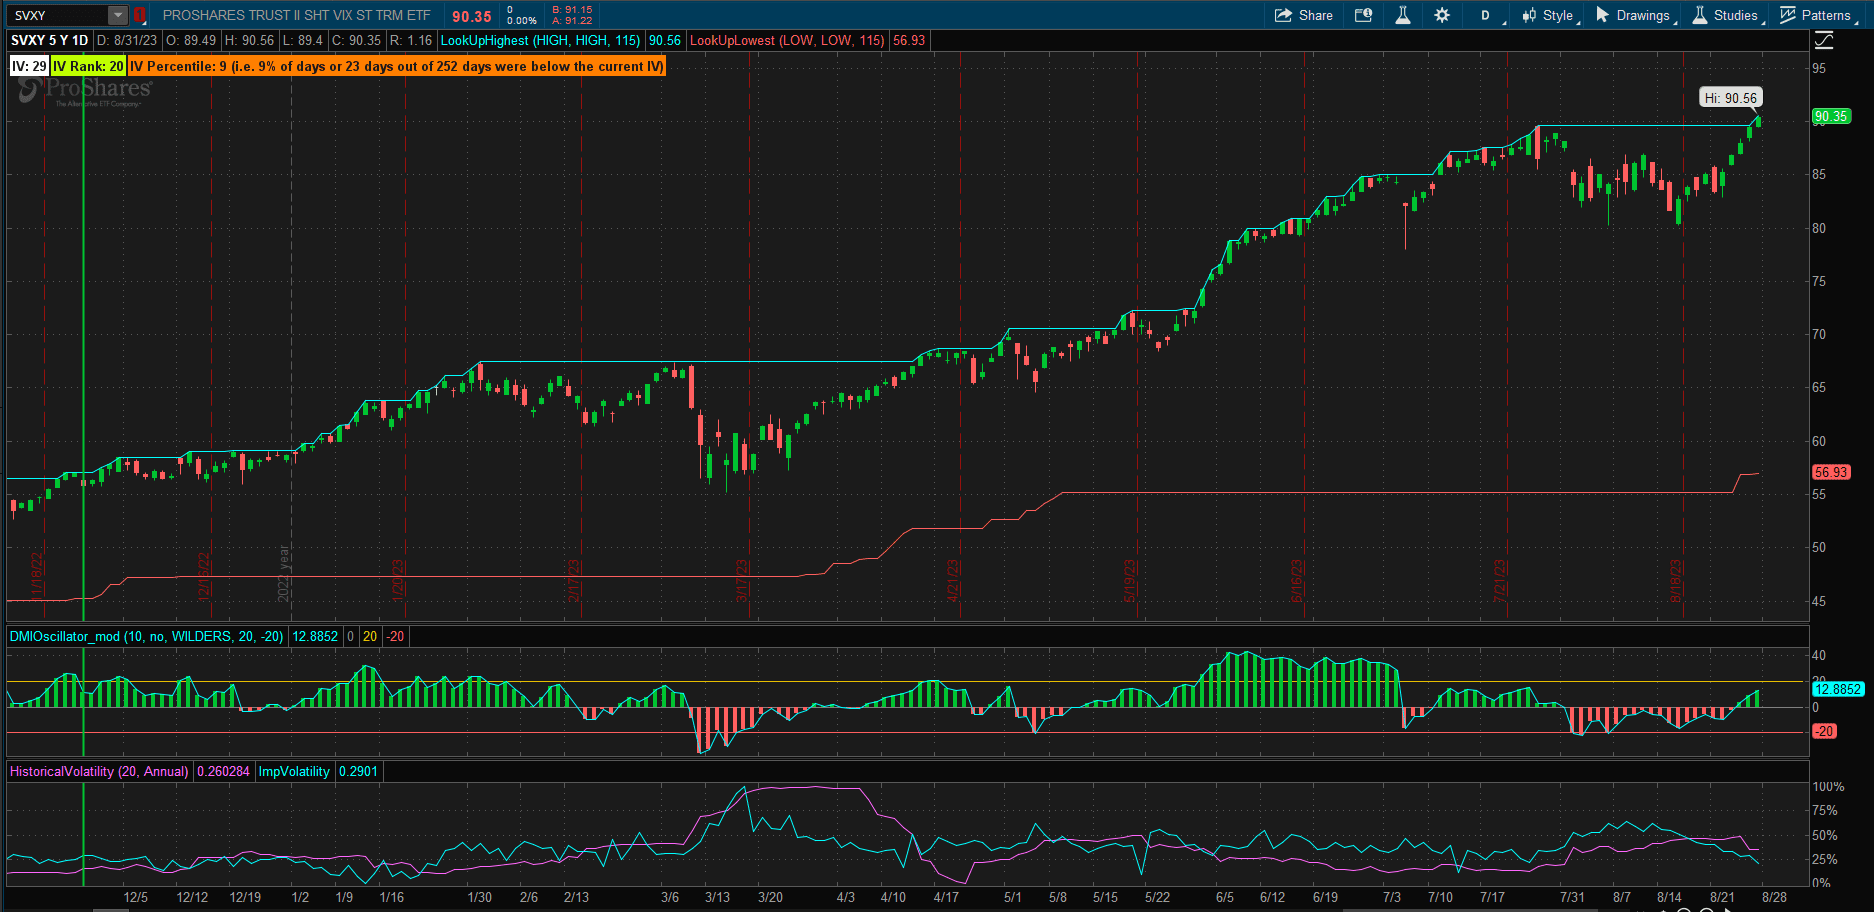 Although, in previous reviews, I have mentioned briefly how nicely this ETF has been performing, I have not focused on it without a reasonable history of performance. Howeve, in the above screenshot we can see that SVXY has delivered a ~63% return in the 9 months since it was purchased. Cutting back to 8 shares brings the allocation back to the original ~10% portfolio value.
Consider adding a small allocation of SVXY to your portfolios.
I am hoping that I won’t need to adjust again for ~3 months.
David
Discover more from ITA Wealth Management
Subscribe to get the latest posts sent to your email.
I have read the posts for the Darwin and I can’t find how the volatility measures are defined and used. Specifically VIX3M I guess is a 3 month average of the VIX? And VIX/VIX3M is the ratio of current VIX to 3 month average? And is the cutoff related to the direction expected of future Vix? I don’t have access to posts before 11/22 so I imagine you have dealt with these issues in earlier posts. Any help appreciated. And nice work.
Jim OConnor
Yes, I covered this in an early post that has been deleted. I’ll try to put together a (hopefully) short explanation in a dowloadable file sometime in the next few days. These (volatility) products are a little complicated and I don’t want to write a book on it but I’ll try to provide something that is understandable 🙂 .
In the meantime check out these links:
https://www.dropbox.com/scl/fi/eea3jdh9cvjicitv1p2qi/vixcentral-2023-09-09_09-00-02.png?rlkey=a10wv62bekqfnwcl1svqxex6y&dl=0
http://vixcentral.com/
Depending on your platform you should be able to get data by using the VIX and VIX3M ticker symbols.
Good Luck until I can get around to more explanations and let me know how it goes
David