
Cruise Cuisine
I do not post a review of the Darwin Portfolio very often because I rarely adjust it and it behaves, for the most part, like a Buy-And-Hold Portfolio. The Portfolio holds a handful of ETFs covering different market segments to provide diversification and reduce overall portfolio volatility. Asset allocation is determined by applying the principles of Risk Parity to even out risk between all assets in the portfolio such that assets with low volatility (e.g. Bonds) are allocated more funds than assets with high volatility (e.g. Equities). On top of this, risk is managed by setting a target volatility to limit both individual asset and overall portfolio risk.
The composition of the Portfolio looks like this:
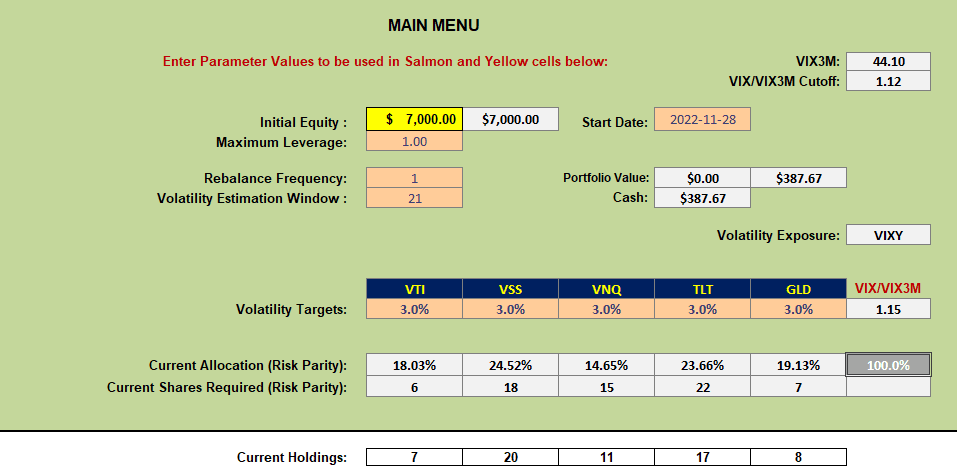
where I am holding positions in five ETFs. The percentage and share allocations to each ETF is shown in the above screenshot where the Volatility Target for each asset is set to 3% – or 15% for the total portfolio. In practice, due the impact of diversification and inter-asset correlations, portolio volatility is usually closer to half this value (i.e. less than 10%).
I only adjust the portfolio when allocations get well off target. Based on experience throughout the management of this portfolio I have found that Quarterly reviews/adjustments are probably sufficient – VNQ and TLT would be likely candidates for adjustment if I were going to adjust at this point in time.
However, I am not going to make these adjustments because I am going to retire this portfolio – but not abandon the management approach. Instead, I am adding more assets to the quiver to match holdings in the “new” Rutherford Portfolio (https://itawealth.com/rutherford-portfolio-review-part-1-3-january-2025/) – in fact I will be renaming the Rutherford Portfolio to the Rutherford-Darwin Portfolio. In this way I hope to show how the same set of assets can be managed very differently – hopefully with acceptable performance for investors with different levels of risk tolerance. This is quite a challenge and I have not attempted anything quite like this before – so be prepared for some excitement.
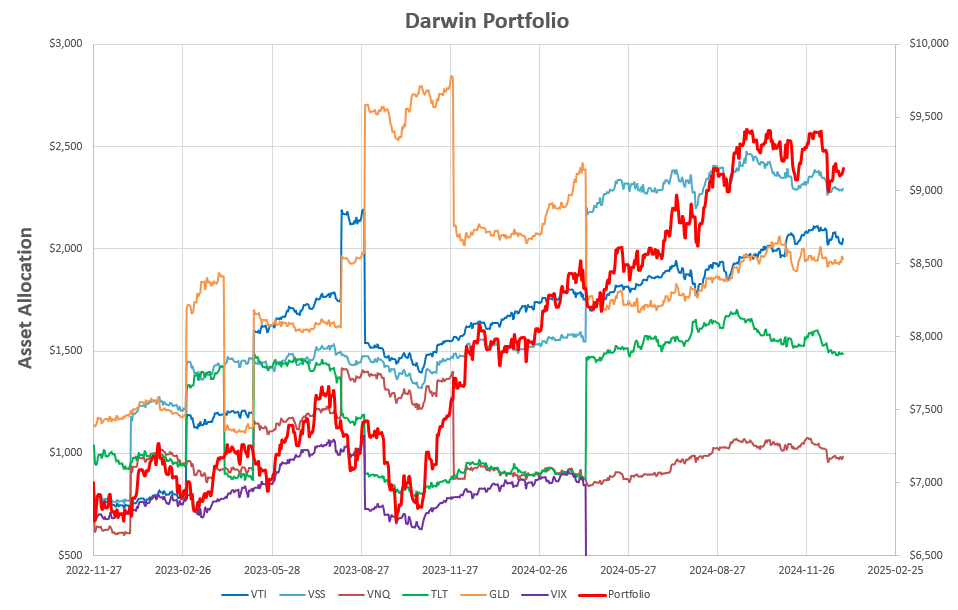
The performance of the current Darwin Portfolio is shown below in two formats – firstly as line graphs of the individual ETFs (thin lines) and the total portfolio (heavy red line):
 and, secondly, as a stacked area chart:
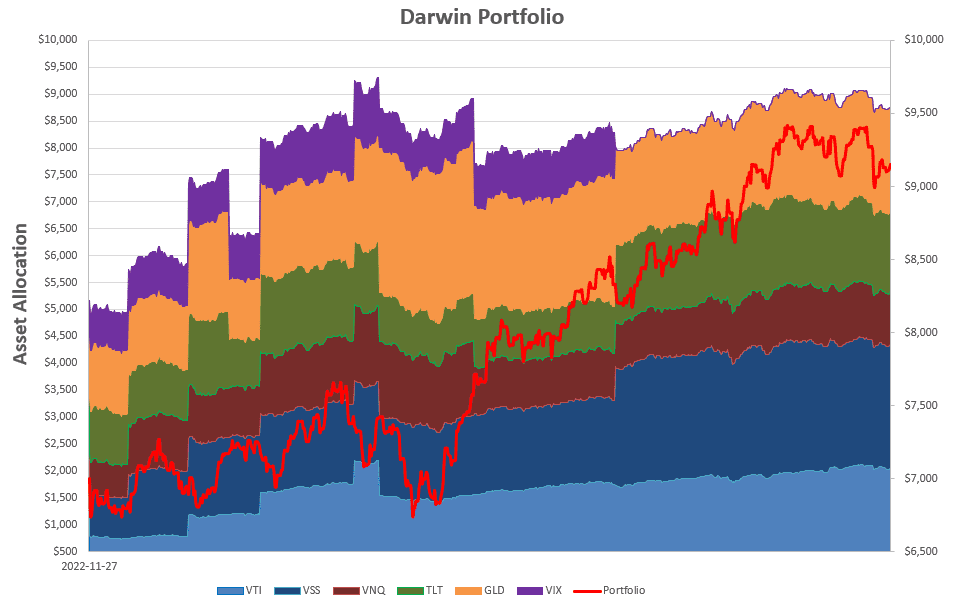 The discontinuities in the charts correspond to where adjustments were made. As you can see, over time, I determined that it was not necessary to make frequent adjustments. Going forward I will monitor from time to time but will probably not adjust more frequently than quarterly.
This portfolio was opened in November 2022 so has run with very little adjustment for a little over 2 years. In this time the detailed adjustments are shown in the following screenshot:
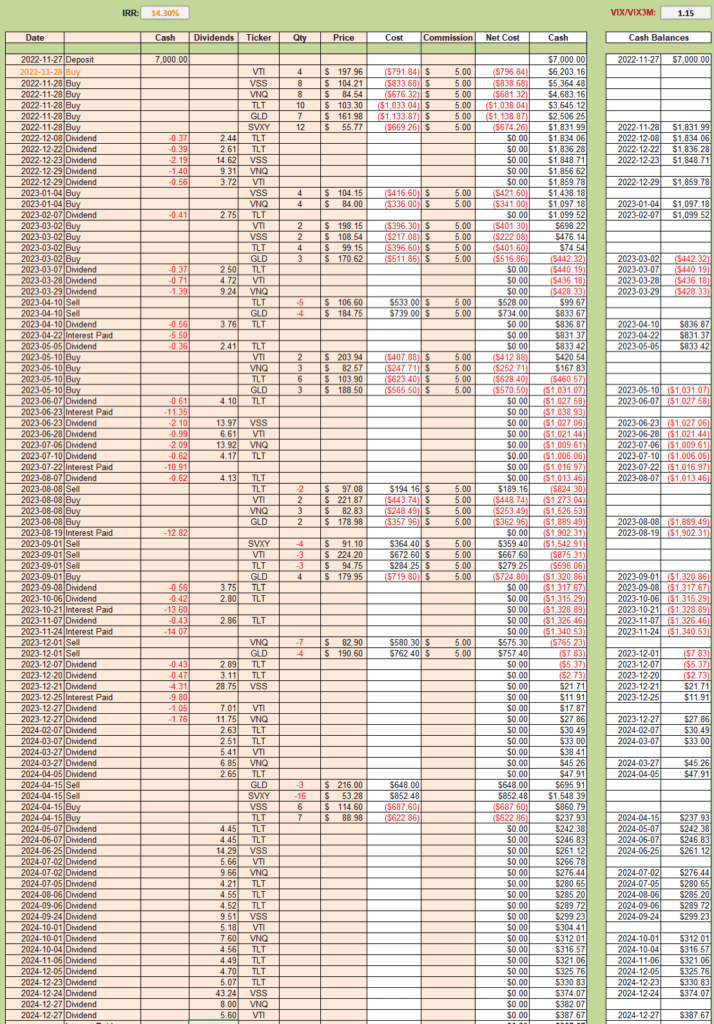 with the most interesting number being the annualized Internal Rate of Return (IRR) that shows as 14.3%. Whilst this does not match the performance of the S&P 500 over this period of time this is the price we pay for diversification and lower volatility. The maximum Draw-Down for the Darwin Portfolio was ~12% in the summer of 2023. I think most of us can probably handle that level of Draw-Down.
If you check the link to the new Rutherford portfolio (link above) you will note that I am adding four more ETFs and reducing the volatility target for each ETF to 2%. We’ll see how that impacts the performance of this type of management strategy going forward.
In summary, this is not my (personal) favorite portfolio management strategy/style – but it does hold some appeal and I can live with an annual 14.3% return if it remains near that level. As Lowell well knows, for some strange reason I do not really like holding assets that I see going down just for the sake of diversification – so I prefer more aggressive/active strategies – it’s just a personal thing 🙂 . It is a nice benchmark for comparing strategies.
Update to answer Lowell’s Comment below.
The total/overall portfolio value is represented by the $value (heavy red line) on the right hand axis (second screenshot). The individual asset contributions are given by the $value (of the thin lines) on the left hand axis. The maximum value ($9,407.32) was hit on October 20. The following screenshot shows the individual contributions and totals through October 2024:
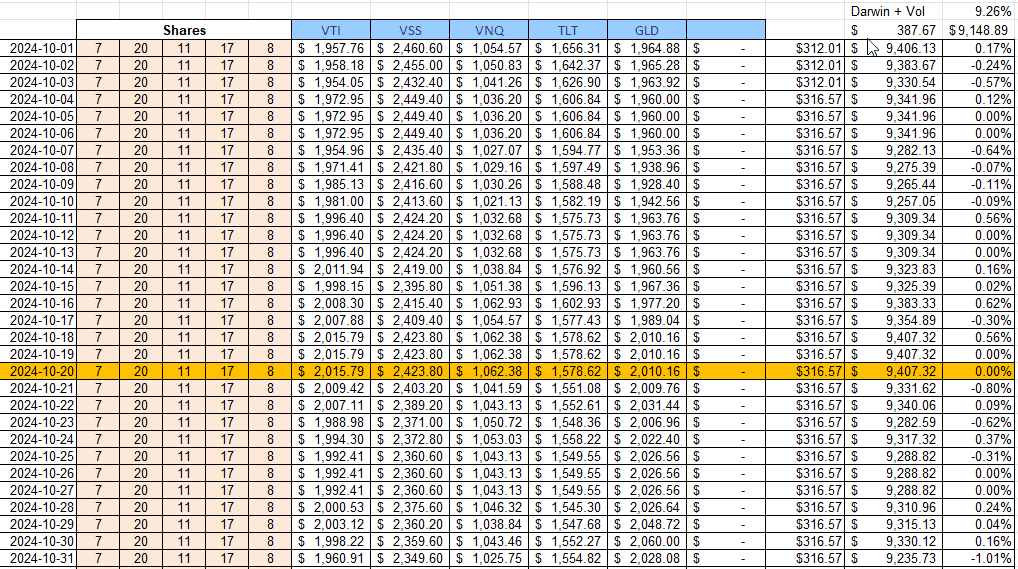
Note also that the volatility of the portfolio over the 2 year period is 9.26%.
Discover more from ITA Wealth Management
Subscribe to get the latest posts sent to your email.
David,
Checking the second screenshot I have a question. I expect the overall portfolio performance to dance around among the other asset classes as it does from 11/27/2022 through October of 2024. Around October of last year the overall performance is superior to any of the subsets that make up the portfolio. How can this be if the sum of the parts make up the whole?
Lowell
Lowell,
I have added an Update to the post above to answer your question. Hope this makes it a little clearer/easier to understand.
David