Japanese Gardens, Dunedin, New Zealand
For investors, the choice of which system(s) to use to manage their portfolio(s) is one of the most important decisions in the portfolio construction/management process.
For many years, the passive Buy-and Hold strategy, whereby we would select a diversified portfolio of assets and simply hold them, almost forever, was a very successful strategy and created a generation of “Bogleheads” – followers of John Bogle, the founder of Vanguard Funds and others like Ray Dalio (Bridgewater) and Warren Buffet (Berkshire Hathaway) with similar philosophies for passive investing. This may still be an attractive strategy for younger investors with a long-term (~40 year) investment horizon – especially if the demands of life are such that there is not much time for attention to what markets are doing. Over the long term, stocks tend to go up, bonds deliver consistent returns and commodities/precious metals have their moments in the sun – so a mixture of uncorrelated assets tends to perform well with relatively low volatility.
However, those of us that experienced the technology bubble and (“dot-com”) crash of the early 2000’s, the financial crisis of 2008 and even the bear market of 2022 – and are in or near retirement – get a little nervous at the thought of losing a significant portion of our hard-earned wealth, and surviving a 40-50% (or even anything over 20%) drawdown on our savings with little time to recover. Thus, as we get older, we may look for alternatives to “passive” investing and go for a more active management approach and a move to Tactical Asset Allocation (TAA) systems as promoted by such managers as Meb Faber (Cambria Investments), Adam Butler (Resolve Asset Management), Corey Hoffstein (Newfound Research), Cliff Asness (AQR Capital Management) and many other current fund managers with access to data and modern technology.
Active TAA strategies tend to be built around the concepts of trend-following and momentum or mean reversion. The two approaches are mutually exclusive from a practical perspective with each system outperforming the other over different time periods – so we need to choose our poison. In general, studies show that trend-following and momentum tend to work better in medium-term time frames (months) and mean reversion often works better in shorter (days/weeks) or longer (years) term time frames. But these periods are not easy to define since different assets/asset classes move in cycles of different frequencies (periodicity). Either way, the objective of portfolio management will be to move in/out of the assets held when market conditions change, and we feel that conditions may be favorable/unfavorable.
If considering a more “active” management approach, we have a choice of selecting funds that are actively managed by their internal managers (where we would rely on their skills/ability to move in/out of assets at the appropriate time) and we would just “buy and hold” these actively managed funds. However, statistics show that very few “active” managers outperform their “passive” counterparts – especially over long periods of time. This may lead us to ask the question as to whether we are smarter than a professional active fund manager and competent to better manage our own money.
Unless we are delusional, the answer to the first part of this question is probably “no” – if only for the fact that we do not have the necessary resources and access to information that they have. However, we almost certainly have more flexibility in the sense that we do not have the same constraints on buying and selling that they may have under the terms and conditions of their mandate. Thus, it may still benefit us to put in the effort to manage our own money – at least we will know who to blame if something goes wrong 😊
When Lowell first started this Blog he focused exclusively on “passive” investing but, over time, he has moved to more “active” approaches of portfolio management – primarily as a result of recognizing that, as we get older, Capital preservation becomes more important than absolute Returns.
A little over 10 years ago, Lowell and I moved several of the portfolios that we manage to “momentum” systems – and the Kipling workbook was developed. At that time, “momentum” was working very well – but, in the intervening period, the general popularity of momentum systems seems to have reduced its earlier efficacy and buying high, selling higher, seems harder to do. This is not to say/mean that “momentum” systems no longer work, but rather that they seem to be less effective than originally observed.
Over the last ~2 years Lowell has moved a few of the portfolios that he manages over to the BPI Sector Model, that is, essentially, a mean reversion strategy – buying when assets are out-of-favor (oversold) and selling when they seem to be overbought. The difficulty of using mean reversion strategies is that they often break down in strong trending markets – but Lowell has a solution for that – effectively moving towards momentum as an alternative to holding Cash – when the market seems to dictate such a move. Be sure to re-read Lowell’s posts on this strategy/model. Over the years I have tried to combine momentum with mean reversion but without success – so watch the BPI system as we go through more cycles. At worst, it should not get us into too much trouble – the likely weakness maybe in missing out on strong bullish trends in the Sectors.
At the present time I am in the process of rebuilding portfolios that I had to liquidate last year to find bridge financing when we moved from the house that we had lived in for the past 23 years to a Condo. Rather than generate another BPI Sector Portfolio I have decided to revise/update my system for “income” portfolios from that presently used for the Hawking Portfolio.
For my new Dirac “Income” Portfolio I have updated/expanded my database of “income” Funds (that I use for the Hawking portfolio) to consist of Closed-End-Funds (CEFs), Exchange Traded Funds (ETFs) and Business Development Companies (DBCs) with high distributions. Although I might not require these distributions for “income” the intent is to re-invest the distributions so as to generate geometric growth from this re-investment rather than relying solely on “growth” from the funds to generate total returns. In this way I hope to be able to weather the storms of future drawdowns rather than feeling that I must exit on all pullbacks. Those who have read my posts in the past know that I am not a big fan of stop-loss orders.
My data base of assets is presently at 120 and I plan to invest ~$5,000 in each of 20 assets from this list in a $100,000 account. I will provide regular reviews of this portfolio, as it is being built, going forward.
Having come from a short-term (day and position) “trading” background in the early 2000’s I was focused, at that time, more on mean reversion than momentum – and momentum was difficult for me to accept as an “investment” strategy other than seeing, heuristically, that it worked.
I am looking for a system that requires little attention and that is “Buy-and-Hold” to the maximum extent possible without the undue risk of high drawdowns. If I look at my best performing portfolios over the past 3 years (e.g. Hawking) I note that the CEF “Income” portfolios have performed best – well ahead of the AOR fund that I use as my benchmark for diversified portfolios – i.e. I wish to retain diversity within the portfolio rather than focus solely on US markets.
In order to come up with a “system” for the new portfolios I have gone through a simple “Quant” analysis, based on the use of the Z-Score of assets, to establish “rules” for investing (hopefully over long periods of time).
What is the Z-Score?
The Z-Score of an asset is a measure of the deviation of price from the mean, normalized to the volatility of the asset or, in mathematical terms:
Z-Score = (Price – Mean)/Standard Deviation
How Will I use the Z-Score?
For each asset I will calculate the Z-Score and look for the assets with the lowest (most negative) Z-Scores. I will then check the short-term Heikin-Ashi plots looking for a bullish reversal for entry.
Below is a screenshot of the first 10 tickers of my asset database (ignoring the AOR benchmark and BIL zero-momentum reference) showing calculated Z-Scores (from Adjusted Close prices) :

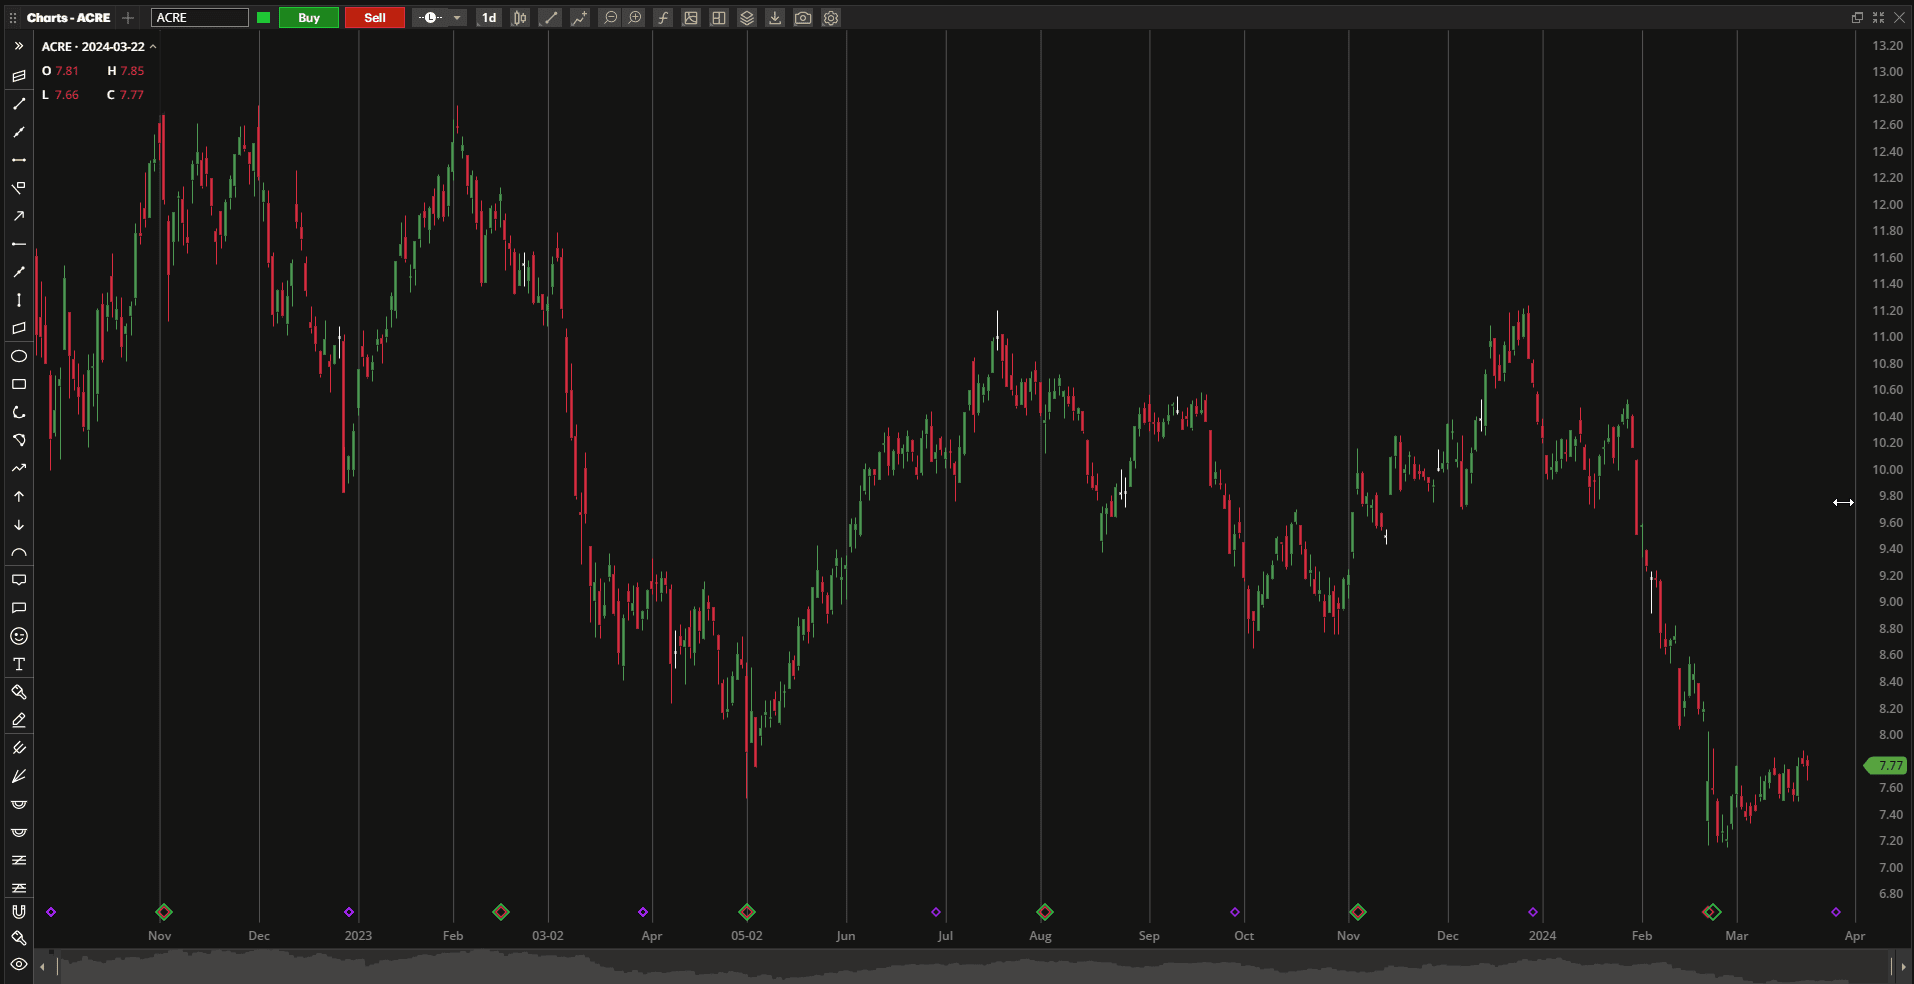
You will note from the above screenshot that the benchmark AOR fund has a positive Z-Score of 2.33 (reflecting current bullishness in the market) while the ACRE Commercial Real Estate Corporation (REIT) has a negative Z-Score of -1.36. With the popularity of Amazon and the impact of Covid-19 restrictions, ACRE (and commercial Real Estate generally) has had a rough time over the past few years:
 but, with Real Estate investments showing more signs of life in recent months it might be worth catching this falling knife right here. The Fund is also presently paying a healthy ~9% distribution on Net Asset Value (NAV) and ~13% on current market price that is at a ~30% discount to NAV.
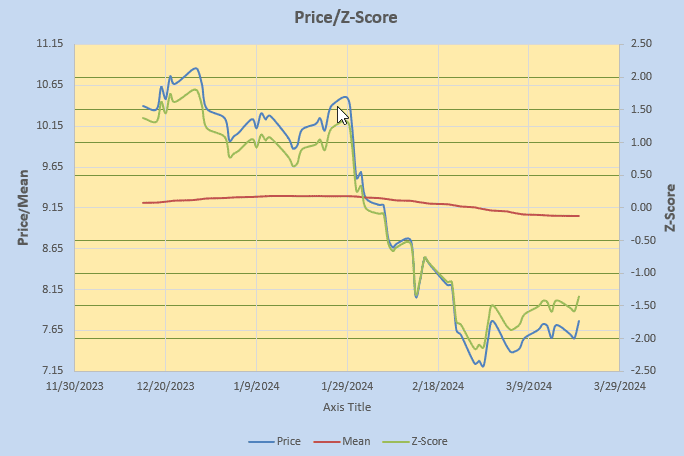
The relationships between Price, Mean and Z-Score are shown graphically below:
 i.e. the Z-Score is simply a scaled/normalized reflection of the Price deviation from the mean adjusted for volatility for fairer comparison between different assets.
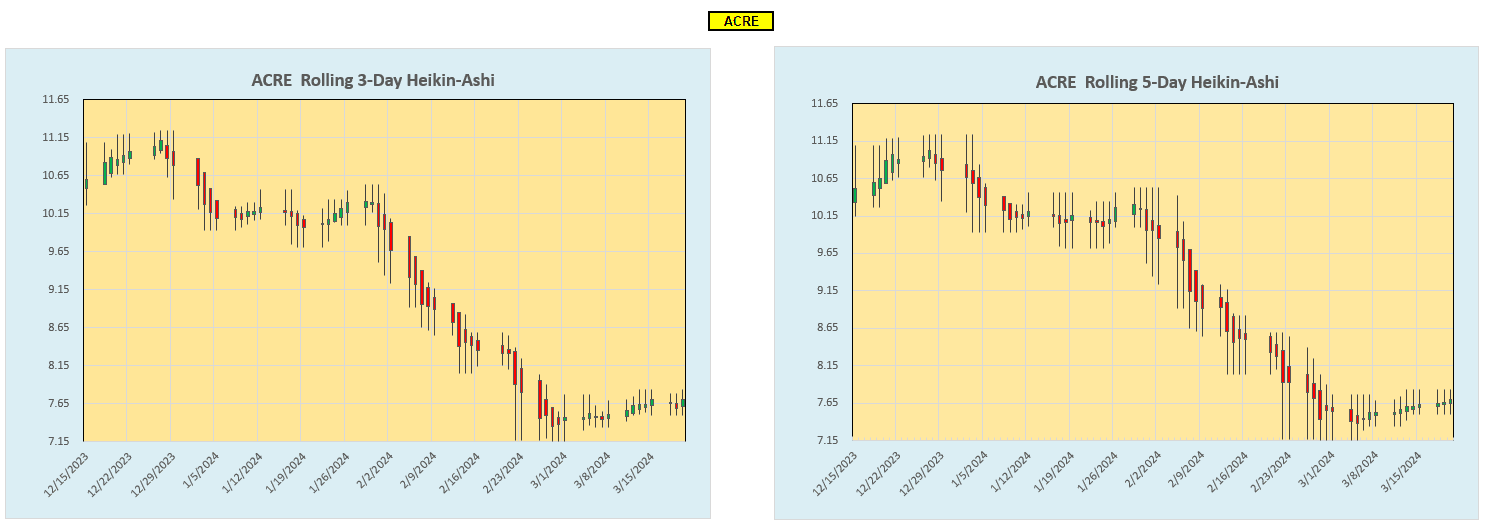
Checking the HA Charts: we see green candles beginning to form on the 3- and 5- day plots – so I will jump in here for a 5% portfolio investment.
Why look at the Z-Scores?
What gives me any confidence that buying assets with low (negative) Z-Scores is worth the risk of trying to catch that falling knife?
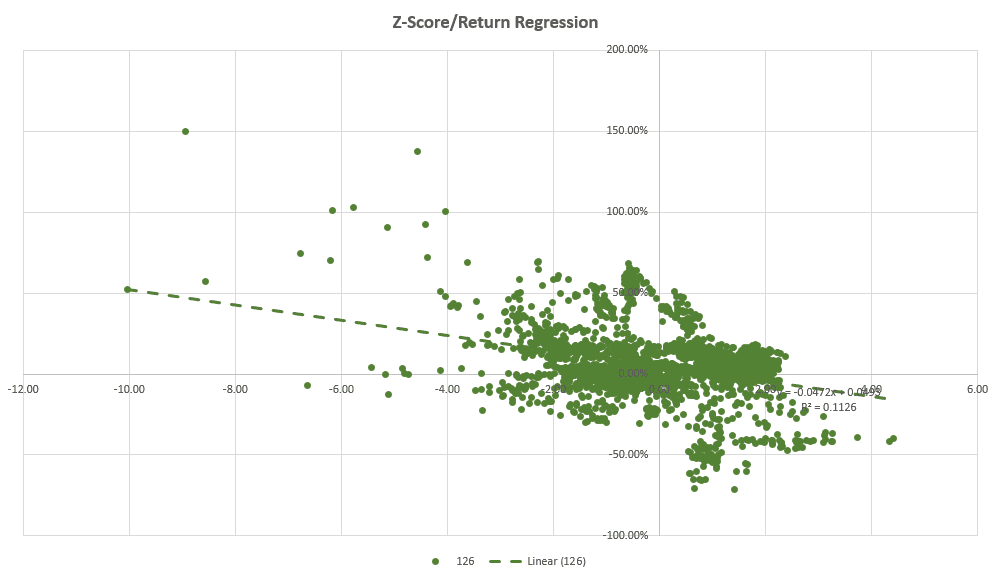
Check out this scatter plot of Z-Score vs forward 126-day (6-month) returns for ACRE:

As we can see from the above plot (~10 years data) and the negative regression slope, when ACRE has had a negative value, future returns tend to be positive. Unfortunately we are not currently at the most negative levels – but worth a shot anyway – and the plan is to hold and pick up the nice distributions (~13% based on current price) with potential for growth due to price appreciation.
By the way, the negative regression slope of Z-Score vs Forward Returns is not specific to ACRE – it’s there for just about all assets with a reasonable price history. Hence the generality of the “rules” for entry.
Plots are also similar for other holding periods (1 month, 3 months) although with more scatter and lower returns.
With the markets at their current high levels there are not too many assets with negative Z-Scores, so it may take some time to populate the new Dirac Portfolio with a full complement of 20 assets. I will therefore be trying to avoid forcing the acquisition of new assets until we see a few pullbacks. Follow along as I build this new portfolio over the coming months and I welcome any feedback/questions that you might have on this rather aggressive mean reversal approach.
Discover more from ITA Wealth Management
Subscribe to get the latest posts sent to your email.
David,
I’ll be interested in following the progress of the Dirac. My first reaction is that it is going to be too complicated for most investors. It may well be that I don’t understand the strategy.
I keep racking my brain for a very simple investing model that combines diversification while providing for capital preservation. The Schrodinger covers the diversification requirement, but falls short on the capital preservation. The Copernicus might work with minor modifications so capital preservation is part of the strategy.
I know a few readers are using the Sector BPI model, but even this model may be too complicated for many investors.
Lowell
David,
I set up a CEF portfolio based on your Hawking model some time ago. Criteria for inclusion include the premium discount and yield. That seemed to be a “buy and hold” approach. Have you become disillusioned with the Hawking approach? Just curious as to why you are moving from it to this new approach based on the Z-score. Am I to assume that you will now be using at least three criteria for security selection: premium discount, yield, and Z-score?
I like your idea about using HA’s for potential entry. I have decided to use HA’s for entry signals in Lowell’s BPI Sector approach once a sector hits the BPI 30 oversold signal. I use a 3/5 day combination. I’ll see how that works over time, if the market ever decides it needs a break (correction :).
~jim
Jim,
I don’t consider this an abandonment of the Hawking approach, rather a refinement/enhancement of the approach with a little “quant” analysis to provide encouraging support to the ideas. Yes, the same premium/discount and yield numbers are considered (as for the Hawking) with the Z-Score added and the HAs used for entry timing (rather than just jumping in anytime). btw I was going to suggest that it might be a reasonable idea to use HAs for timing entries for the BPI model too – but I forgot to add it – so thanks for reminding me. And well done on pointing this out !!
I may add a separate post sometime in the next few days with a little more detail/explanation of the Plan – so stay tuned.
David
Jim,
What software (XIRR with Excel) are you using to calculate your performance and what is your benchmark?
Lowell
Jim,
How is your CEF portfolio performing compared to your benchmark? You see from my posts how the Hawking compares to AOR over the past ~3 years but timing is important – I think Lowell probably abandoned the approach because he was not seeing good performance as a result of unfortunate timing when he set up his portfolios. This is one reason I have included the idea of using the HA signals on entry.
David
David,
I bought most of my CEFs in March/April 2023 using the premium discount and yield criteria. Returns range from 6% for IHD and NCZ to 25% for KIO. The average return for the approximate year is 12.2%. I have 10 CEFs, all selected from your Hawing portfolio. I added one additional criteria and that was the total leverage ratio. I can’t remember what I used for that ratio at the time.
A question: Do you have criteria for when you consider selling a CEF? KIO currently has a premium discount of only -1.76% and the estimated distribution rate/yield is only 10.9%. I’ve given consideration to setting some kind of TSLO or sum of premium discount and yield on KIO since it has done so well (preserve profits) and the sum of the premium discount and yield are so low.
~jim
Jim,
As I mentioned in the post I would like this to be a “Buy-and-Hold” portfolio – and I don’t like SLOs.
Having said that, If I feel that something has really overshot the mark and there are better opportunities out there I will sell/replace a holding. Obviously, one thing that I will be looking at is the Z-score since the regression analysis indicates that forward returns may be lower for high Z-Scores. This means that I prefer not to have super rigid rules for selling – but that a high Z-Score might prompt it if there was a better opportunity (another asset with a negative Z-score and probabilities of higher returns looked significantly better).
Specific to KIO my listing (at the last update) looks something like this:
https://www.dropbox.com/scl/fi/fhlglsbxkeuvbn6729j30/KIO-2024-03-26_10-49-51.png?rlkey=r2nicaqbab3dkfe7ycmf6eu8o&dl=0
with a Z-Score of 1.99 – getting up there.
This isn’t enough for me to consider selling KIO at the moment (unless, perhaps I didn’t hold ACRE and was comfortable with the switch in diversity) – since there isn’t much in the negative Z-Score range and ~11% isn’t too bad a return.
Hope this answers your question.
David
Lowell,
You probably don’t want to hear this, but I don’t use a benchmark, unless the use of the S&P500 index is considered a benchmark. In that case I use VOO.
~jim