
Kew Gardens, London, England
It was another week of choppy sideways movement in US equities although the SPX did close higher by ~1.5% and close to the all-time highs that have been providing strong resistance over the past 3 months:
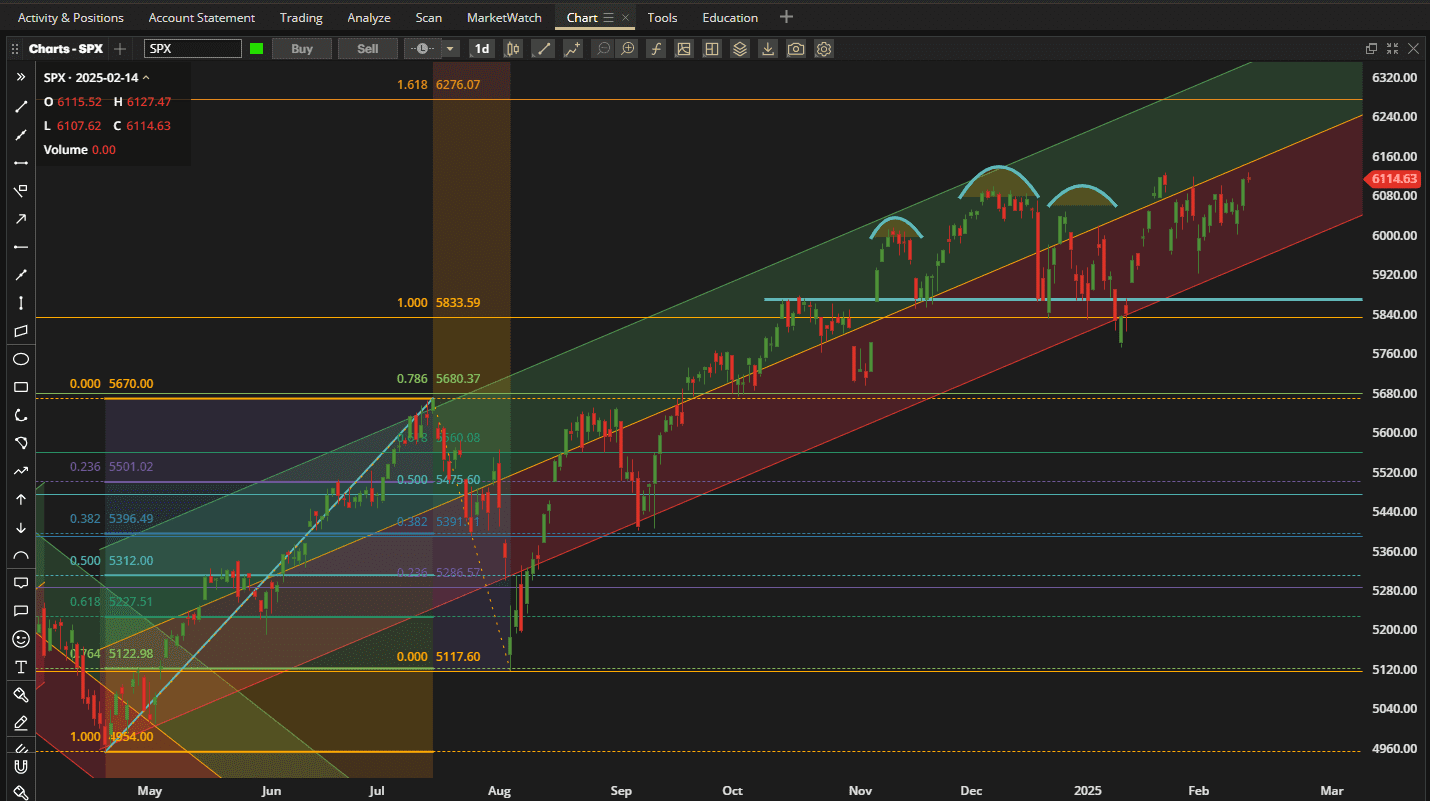 However, we remain well within the bullish uptrend channel so we will watch to see where we might go from here.
In terms of relative performance, US equities did not outperform international equities over the past week:
 in fact, international equities have generated ~2x the return of US equities over the past 1 month and 3 month periods – although this ratio is the other way around over the past 6 months. This might suggest that we are seeing a rotation in investment sentiment – so it will be prudent to watch these markets going forward.
Checking on the Rutherford-Darwin portfolio we still have ~$50,000 invested in BIL (Short-term US Treasury T-Bills) that have so far contributed $267 “risk-free” dollars to the account.
The $10,000 allocation of funds to the 9 ETFs selected for the diversified “Buy-And-Hold” portion of the portfolio (Darwin) added ~$130 to the cause over the past week and is now up ~$300 since inception 6 weeks ago:
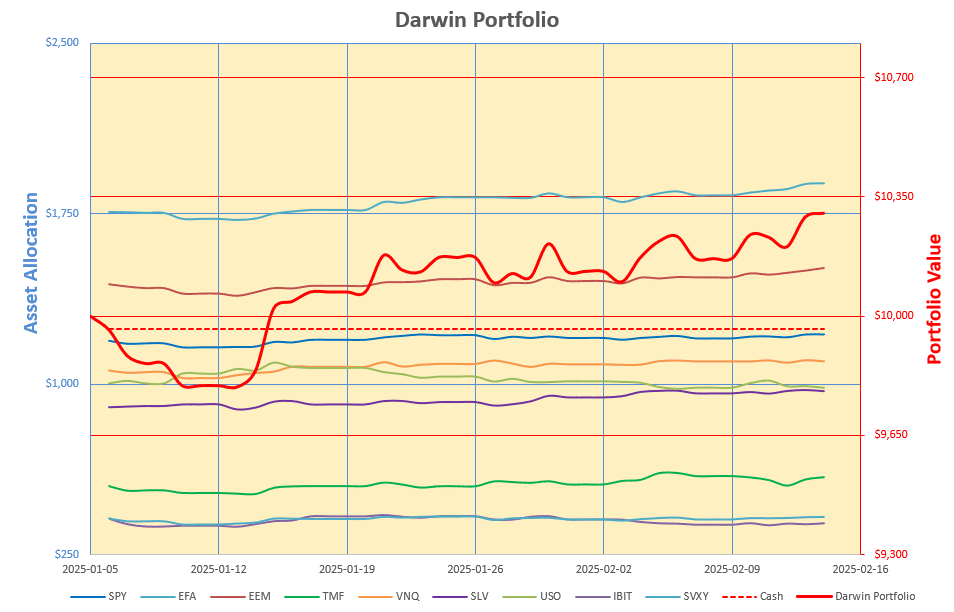 [Note: Somehow an error crept into my worksheet 2 weeks ago so the performance figures shown for the Darwin portion of the portfolio over the past 2 weeks were slightly in error – although the finishing totals were correct. This error has now been corrected.]
The performance of the leveraged Option portion of the portfolio looks like this:
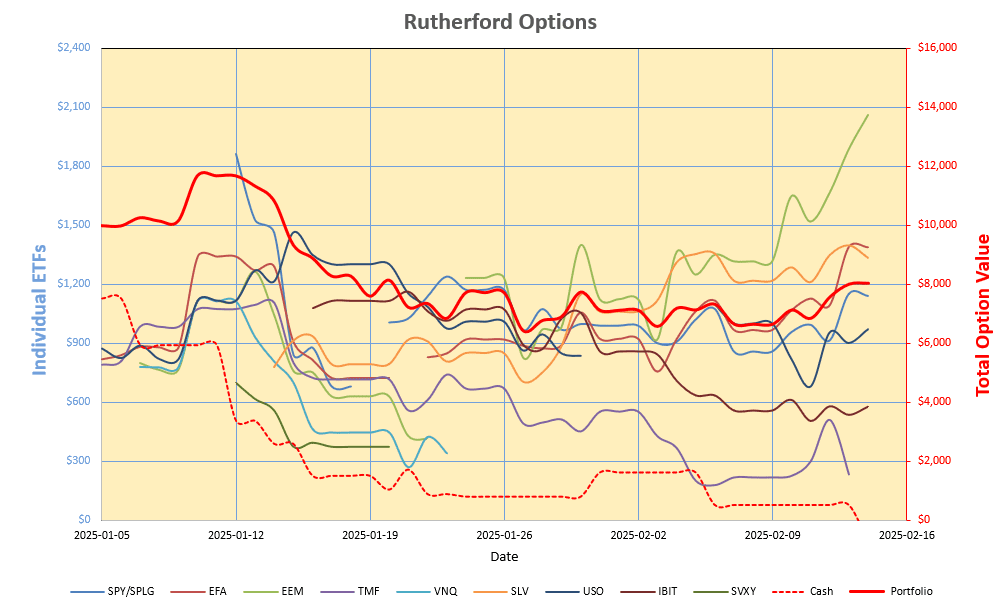 and has shown a gain of ~$1,400 on the week thanks to the strong increase in the value of global equities over this period. Although the weakest asset class over the past week (and I am holding Puts that will benefit from further declines), I have sold my bearish (Put) position in TMF since the Option is sitting at the $42 At-The-Money (ATM) strike with maximum premium that will decay rapidly with only 7 days to go to expiration on 21 February. This was a losing trade as TMF has risen in value over the past 5 weeks. I have replaced this with a bullish position in VNQ (US Real Estate) by purchasing 2 contracts of the $86 strike Call Options expiring on 21 March (in 35 Days). These Options have a Delta of ~0.80 so is equivalent to holding 160 shares of VNQ (compared to 12 shares held in the Darwin portion of the portfolio).
The overall picture of the portfolio performance looks like this:
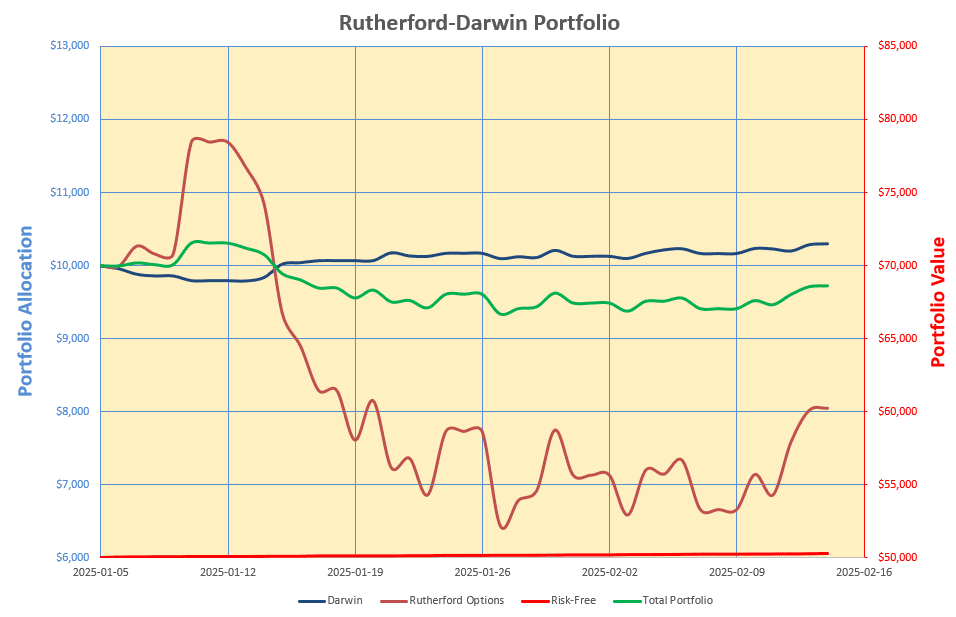 with a comfortable 13.5% volatility (green line). Obviously my objective is to improve the performance of the Options portion of the portfolio – with 10:1 leverage this should be easy to achieve if I can stay on the right side of the price movement. I am using a trend following approach to achieve this rather than a mean reversion approach – however, in this sideways choppy market, it is not easy to find strong (bullish or bearish) trends – so I may have to try to find a way to stay out of the chop.
Update: 18 February, 2025
With IBIT looking weak this morning and with my long (Call) Option expiring on 28 February (11 days) I have sold the Option – recovering what is left of the premium – so as to avoid major time decay and the Option possibly expiring worthless. This results in a loss of ~$528, or ~50% of the price paid for the Option. My plan is to try to keep losses to a maximum of 50% of the price paid.
This is what I am presently looking at:
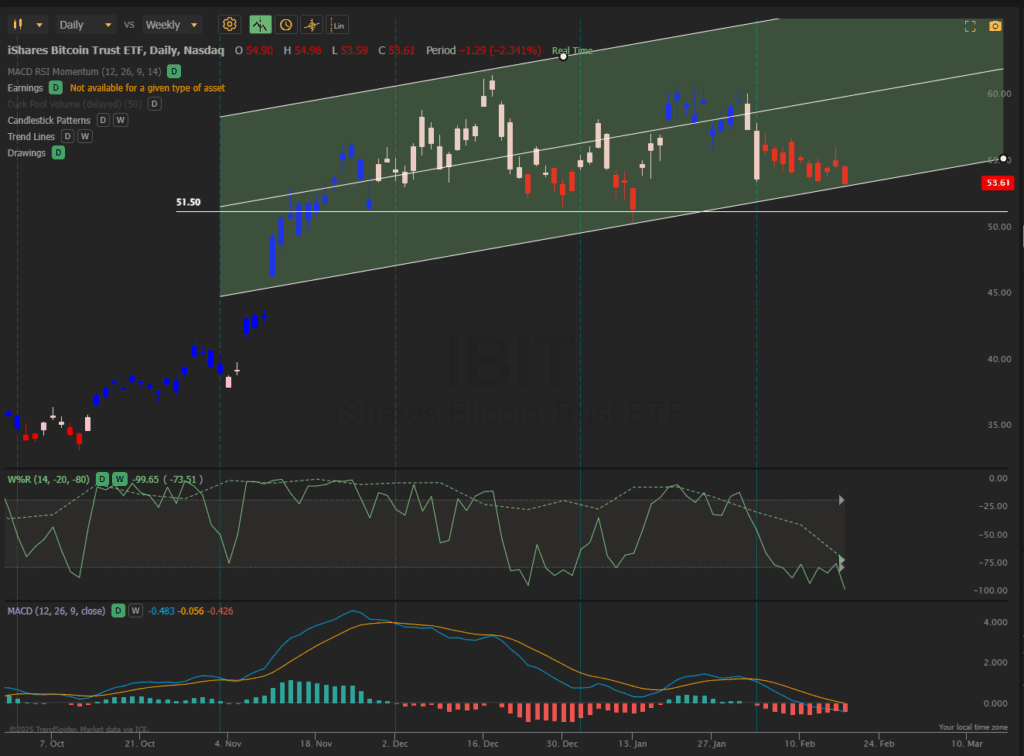 IBIT is presently sitting at the bottom of a bullish channel and we may see a bounce that would continue the trend. However, we might also see a breakout of the channel and the strart of a bearish trend. With only ~10 days before expiration of the 28 Feb 50 Call Option, I have recovered what is left of the premium and will use it to enter a new position when the picture gets a little clearer.
I realize that most investors do not look at technical indicators very often, if at all, but the above chart is interesting in that the candles colored red correspond to prices where the Moving Average Convergence Divergence (MACD) indicator is suggesting a bearish trend and the Relative Strength Index (RSI) is showing negative momentum and may even be in an oversold position. The Williams%R indicator (green line in middle panel) is also a momentum indicator that suggests when an asset maybe overbought or (in this case) oversold. Contrarian investors/traders often use these indicators to go against the trend and to look for reversions to the mean. This works best when prices are moving in a sideways consolidation range but does not work well in strong trending markets when prices can stay overbought (when bullish) or oversold (when bearish) for long periods of time. A break below ~$51.50 in IBIT would establish a lower low and maybe a new bearish trend following a lower high between December and January. On the other hand a bounce back towards the centre of the channel would support a continuation of the current trend. We’ll wait, watch and see where we go from here before opening a new position. I favor following trend and momentum so the regions with blue (bullish) and red (bearish) candles are where these 2 indicators align. White candles are where we get mixed signals.
SLV
I have also rolled the 28 February 26 Calls in SLV up to the 28 strike for 1.90 – bringing in 4 x $190 = $760 on the 4 contracts held. This takes practically all of the risk off the table and still leaves me with 4 Call contracts at the $28 strike. The 26/28 spread can only be worth a maximum of $2 x 100 = $200 so I have only given up $10 per contract to take all my risk off the table. I now have a “free” run on the 28 Calls with SLV presently at ~$29.90 or close to $2 In-The-Money – $200 per contract ($800 total) of Intrinsic (real) value or unrecognized profit.
Discover more from ITA Wealth Management
Subscribe to get the latest posts sent to your email.
Hi,I’m very interested
With IBIT looking weak this morning I have sold my long (Call) position that expires on Friday so as to avoid further time decay. I am now out of IBIT until I see a definite (maybe) trend.
I have added an update to the above post to provide a little more detail/explanation – for education purposes only 🙂
I have also adjusted my position in Silver (SLV) as noted in the above update.
David,
With all the option trading have you ever read the book, “Flash Boys” by Michael Lewis?
Lowell
Yes, I read that book when it was published at the height of the concerns over High Frequency Trading (HFT). It’s well written and an interesting read. At the moment I’m watching Nancy Pelosi – she makes BIG bets using Options – and she does very well 🙂 . I wonder how long it will be, if ever, before politicians/members of Congress are not allowed to trade while in office – there’s obviously a serious question of conflicts of interest/insider trading in a number of cases.
David
I have rolled my long (Call) positions in equities (SPLG, EFA and EEM) up (in strike price) and out (in time) to the 21 March expiration (30 days). I will provide more details/explanations in my week-end review, but this locks in some profits and reduces risk on these positions.
David