
Merlion Fountain/Statue, Singapore
Which Assets Should I Consider Holding and What System Should I Use to Manage my Portfolio?
These are questions that all investors will ask. The answers are not simple or straightforward and will depend on our goals, objectives, tolerance for risk and even prejudices.
Let’s start by looking at assets that we might hold – and why.
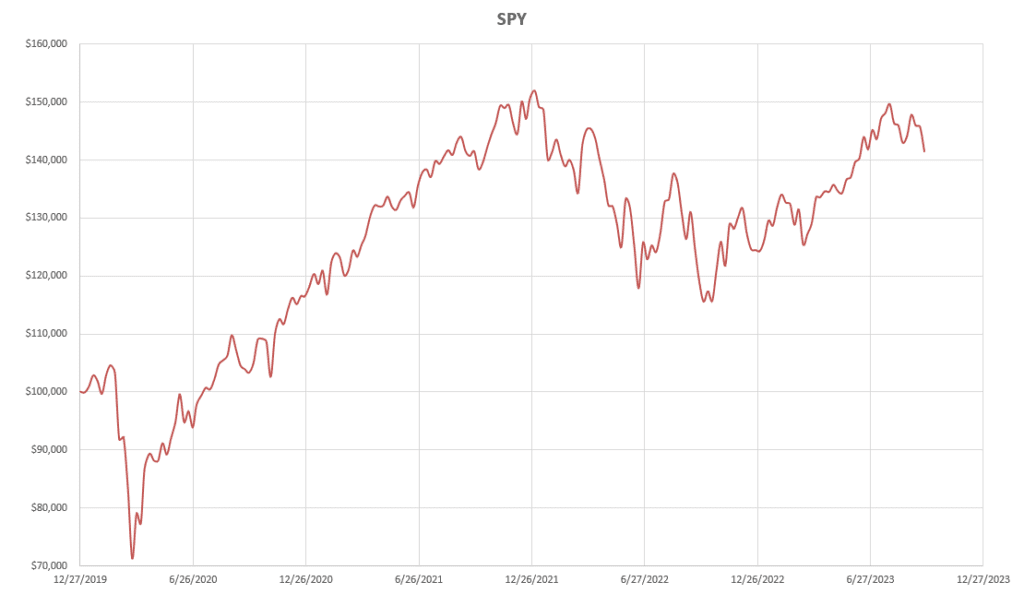
If we are strongly nationalistic we may wish to invest only in companies/assets within our own native country. For most readers on this site this will be the US equity markets. Therefore let’s take a look at the performance of SPY, the most heavily traded ETF tracking the S&P 500 Index, since the beginning of 2000 (pre-Covid):
 I pick this period for a number of reasons:
- It is recent/up-to-date;
- It includes a “flash crash” – 2000 Covid “crisis”;
- It includes a “fast” recovery/strong bullish trend (mid 2020 – end 2021);
- Significant (but “normal”)/prolonged bearish trend (2022);
- “normal” bullish recovery (2023);
- In terms of longer-term price movement – a sideways market (mid 2021-current/mid 2023);
- I want to run (manual) back-tests and this period requires a “reasonable” number of calculations 😊
Of course, we don’t particularly need to be nationalistic to prefer trading US markets – they are the most widely traded and diversified markets in the World, and we may be content to trade these markets and to see if we can beat the performance of the S&P 500 Index (or SPY).
However, we may realize that, despite the recent dominance/out-performance of US equity markets, there have been/will be periods of time in which other markets outperform the US markets – so we might prefer to diversify (to reduce risk) – even if this might come at the expense of lower returns. A simple way to do this might be to hold the AOA ETF – an aggressive 80/20 Equity/Bond portfolio built from US and International equities/bonds.
The performance of this Fund, compared with SPY, looks like this:
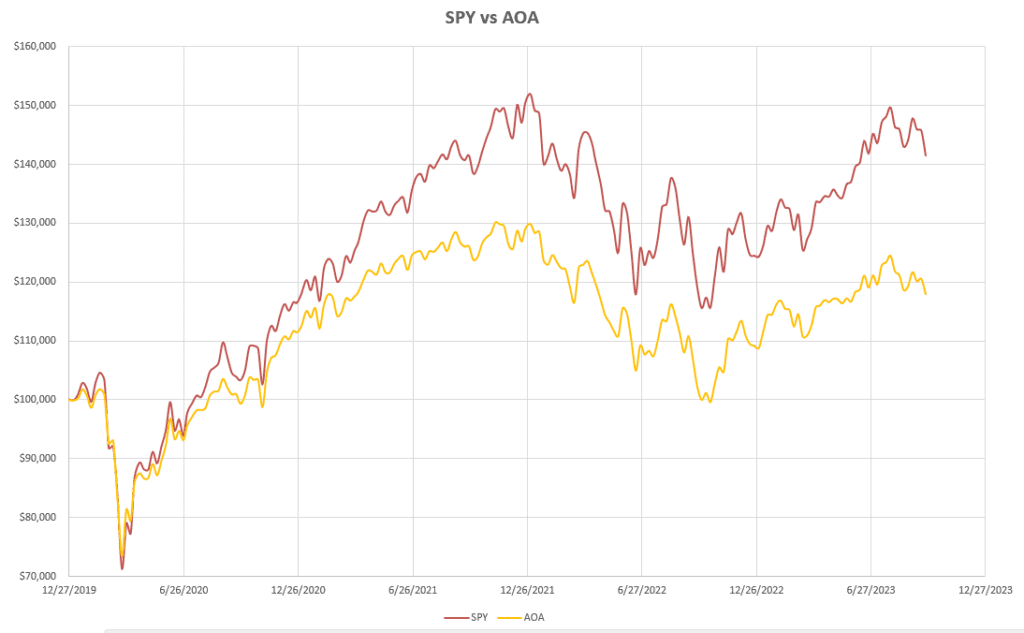
i.e. we give up something in returns in exchange for less risk/lower volatility – although the maximum Draw-Downs in this period (between December 2021 and September 22) are essentially the same at ~24%.
These are the trade-offs we make when diversifying our portfolios.
However, we might prefer to improve our returns and reduce our risks (volatility and Draw-Down) by actively trading our portfolio using a “system” that may help us achieve these objectives.
This is where it begins to get “philosophical” in that there are (at least) two trains of thought:
- Adopt a “contrarian” or “mean reversion” approach that attempts to buy “over-sold” assets and sell “over-bought” assets on the premise that prices will revert to a “mean”;
- Adopt a “momentum” approach that believes (as Newton did) that “ a body in motion stays in motion”.
We all like the idea of “Buy Low/Sell High” – that is easy to understand/accept for a mean reversion strategy but more difficult for a momentum strategy – where this becomes “Buy High/Sell Higher” – it’s all relative.
For “contrarian” investors we may have difficulty rejecting the “Don’t try to Catch a Falling Knife” advice – and. effectively, rejecting the “momentum” philosophy.
So, are the two strategies mutually exclusive? Yes, probably, at least within the same “system” – but, at the same time, they can both be equally effective if used separately and consistently – especially if we consider the time frame of the investment decisions we are interested in.
In reality, I like/use both systems – but which system I use depends on the time frame that I am focused on. For short-term (<1 week) or long term (>12 month) trading I prefer to use mean reversion strategies – for intermediate term (1 week – 12 month) trading I favor momentum strategies – even though I am less comfortable with these strategies.
As regular readers of https://itawealth.com/ will know, I have long thought that a momentum rotation system should be a good candidate to separate better performing assets from poorer performing assets. In particular, I have always thought that we should be able to come up with a system that would outperform the broad market (SPY) by selecting sector ETFs (components of SPY) that were/are likely to continue to outperform the broader market. But, I have never been able to convince myself that such a system exists to the extent that it justifies the costs of trading such a strategy rather than simply holding the Index.
In this post, I am not going to go into the details and reasoning behind the system that I will be using to test the above belief, but, after ~3 years of taking a serious look at the strengths and weaknesses of momentum systems (in an environment that has not been friendly to most conventional momentum systems), I have come up with something that I am more comfortable with. I will refer to this as the Dual Momentum Rotation (DMR) strategy/model. The model does not differ all that much from the classical use of Dual (Absolute and Relative) Momentum – and the systems built into the Kipling workbook – except in subtleties in the way that momentum is calculated and the look-back period used. It also incorporates the concepts of Risk Parity and targeted volatility.
So, with the objective of out-performing SPY, over the past 3¾ years, let’s take a look at the relative performance of the Sector DMR model/system relative to simply holding SPY:
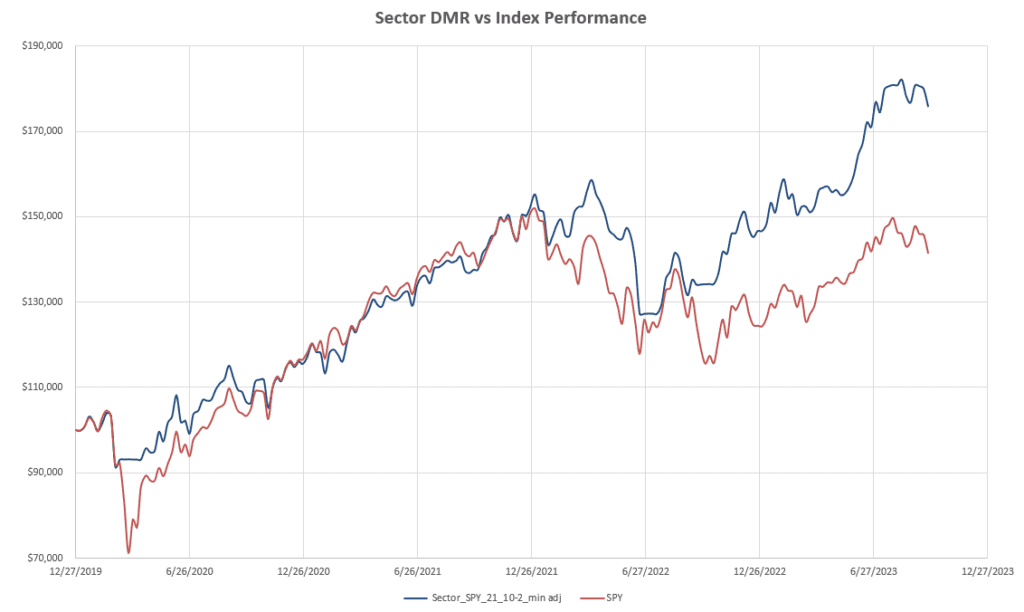
Here, we note the effective avoidance of the potential ~30% Draw-Down resulting from the un-anticipated Covid “Crash” crisis. Then, in the subsequent bull market, from mid 2020 to December 2021, there was little difference between the “active” DMR model and simply holding the index (SPY). However, when the correction kicked in in 2022 we see that, overall, the DMR system outperformed the simple SPY Buy-And-Hold strategy, resulting in lower Draw-Downs, and remained ahead of the index through the 2023 bounce. Terminal performance shows a ~75% return over the 3¾ years.
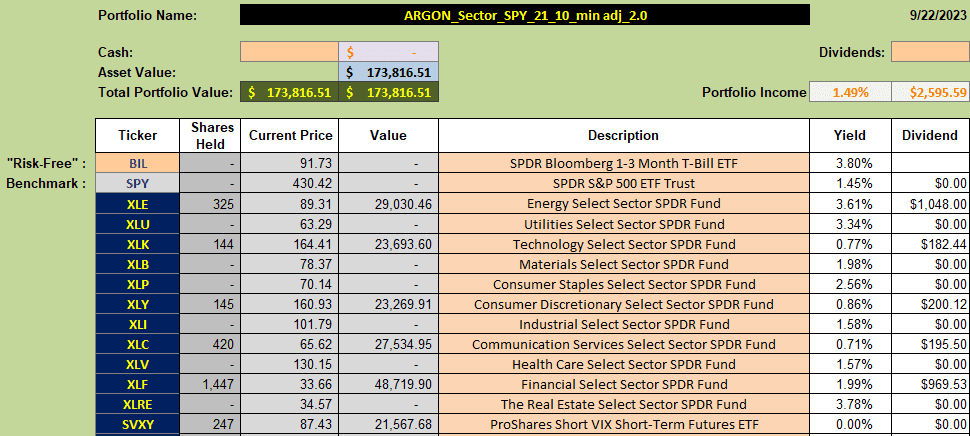
Here is the sector breakdown of the broad US Equity markets used in the above back-tests:
 Now, let’s assume that we wanted a more diversified “global” portfolio and chose to use the Rutherford Portfolio of assets:
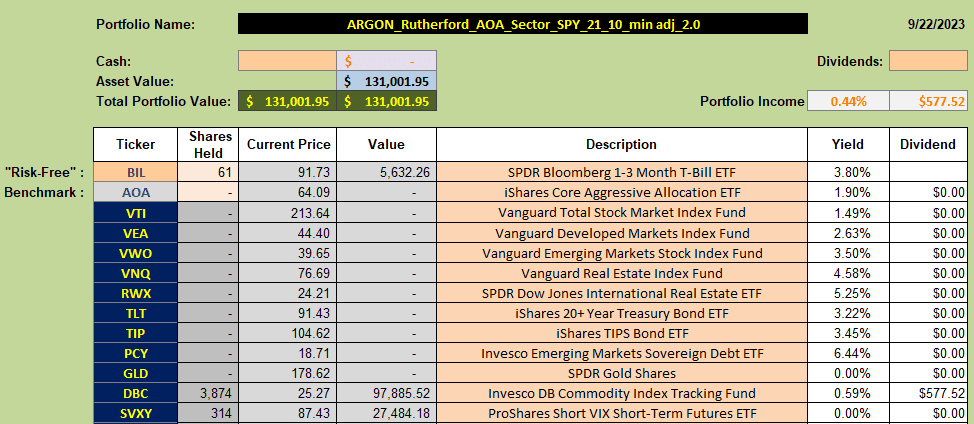 In this case our benchmark to beat is the AOA Fund:
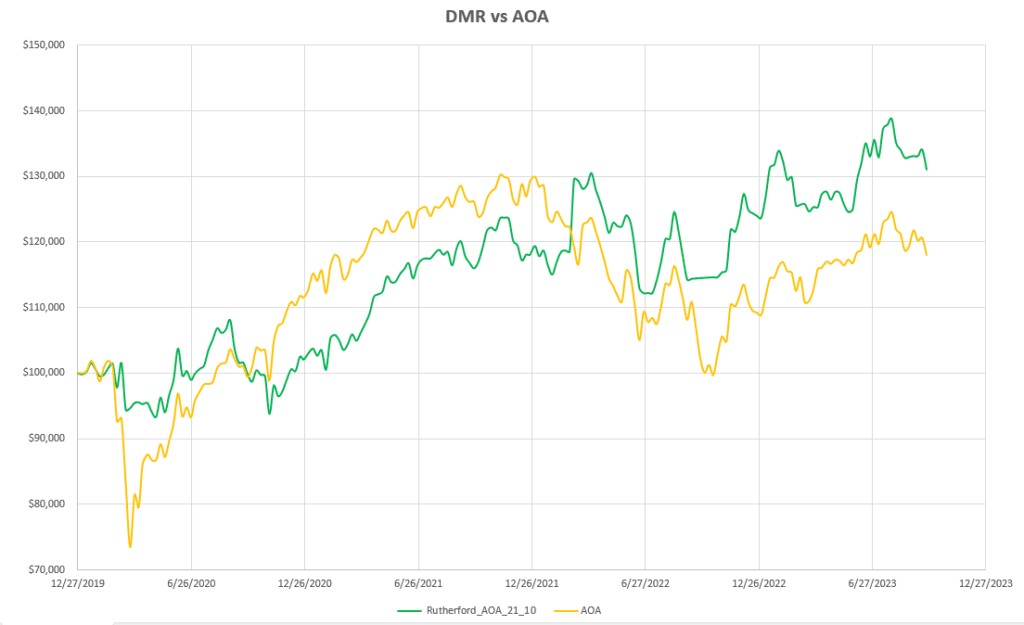 Again, we see that the DMR model avoided serious trouble through the Covid “Crash” – but then lost it’s advantage a little before matching (parallel) benchmark performance through to the end of 2021 and forging ahead through the 2022 downturn and 2023 recovery – ultimately beating the benchmark by ~10% over the 3 ¾ years with ~30% total returns.
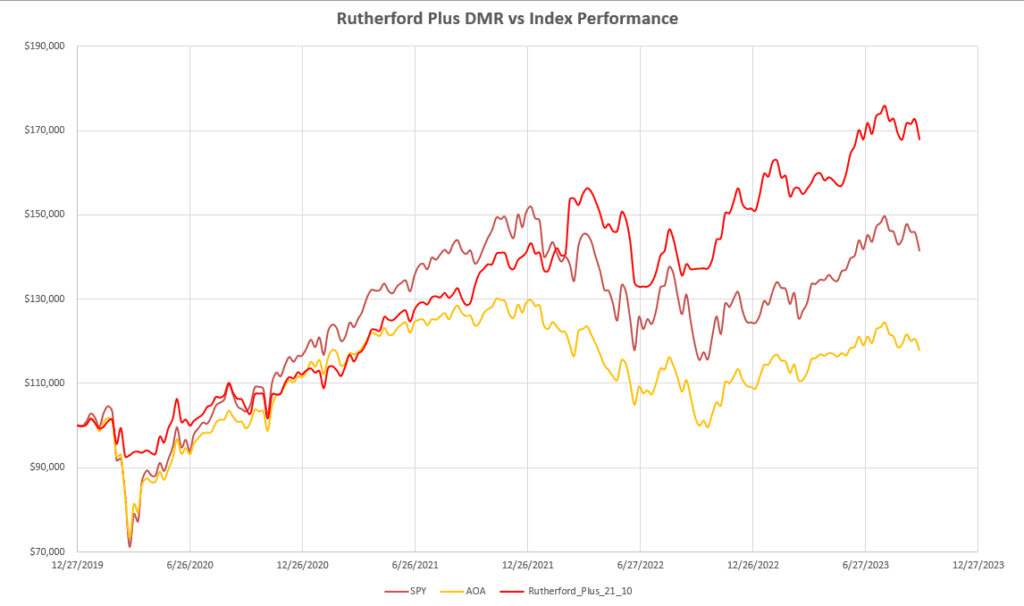
Comparing the performance of the two portfolios (both using the same DMR system) we get the following picture:
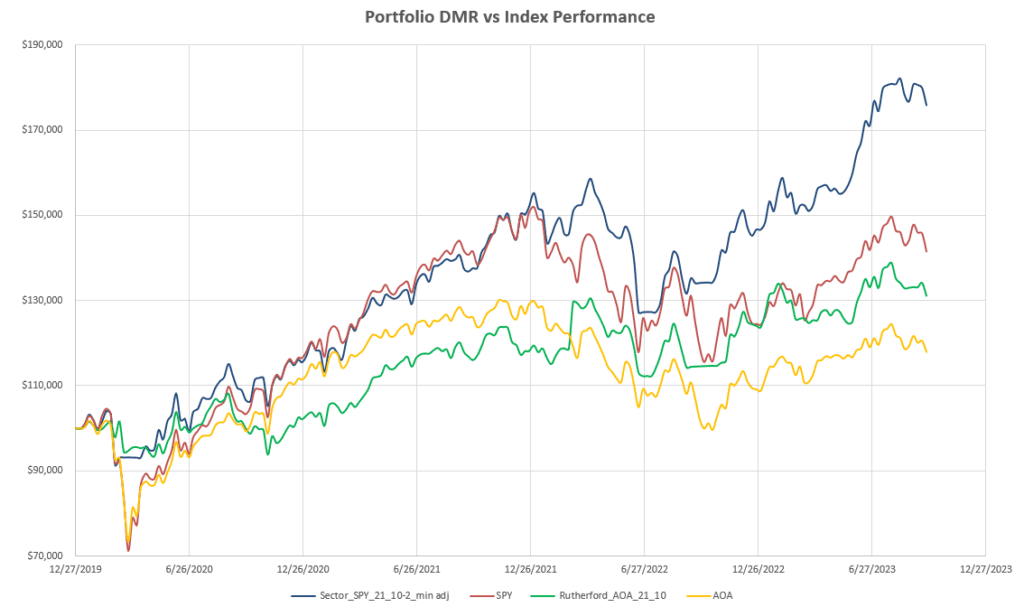 So, we see that, while we may well give something away through diversification, we can still come close to matching the performance of the best performing asset class (SPY). If we knew that US equities were always going to outperform other asset classes we would obviously simply stick to investing in this asset class.
Of course, this then begs the question as to what happens if we throw all these ETFs into the same portfolio and manage through the same DMR system. I will refer to this as the Rutherford Plus Portfolio because it is based on the basic (diversified) Rutherford Portfolio but with US Equities (VTI) broken out into the major market Sector ETFs. Since this is a diversified Global Portfolio, I use AOA as the benchmark:
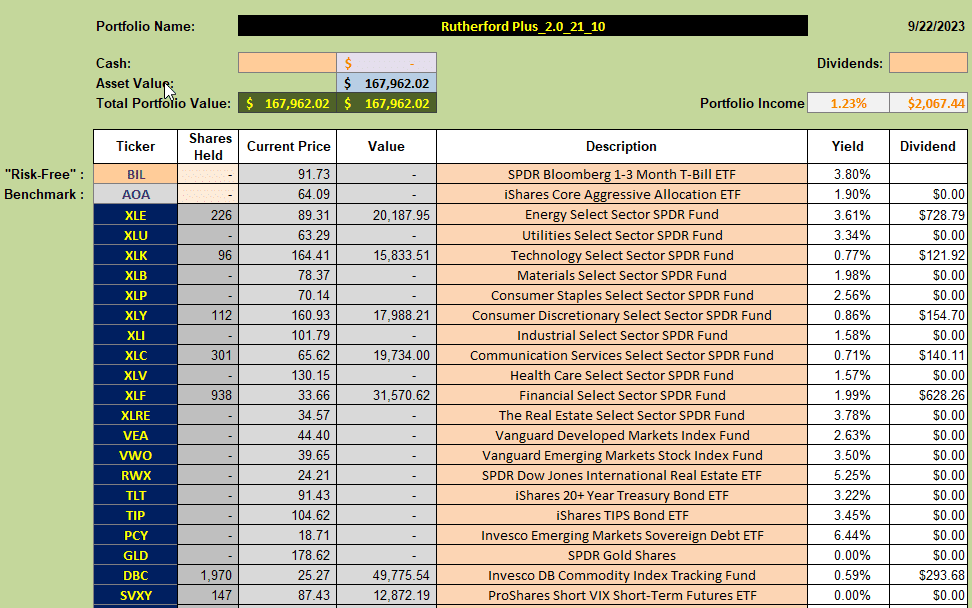 With application of the DMR system producing the following results (red line):
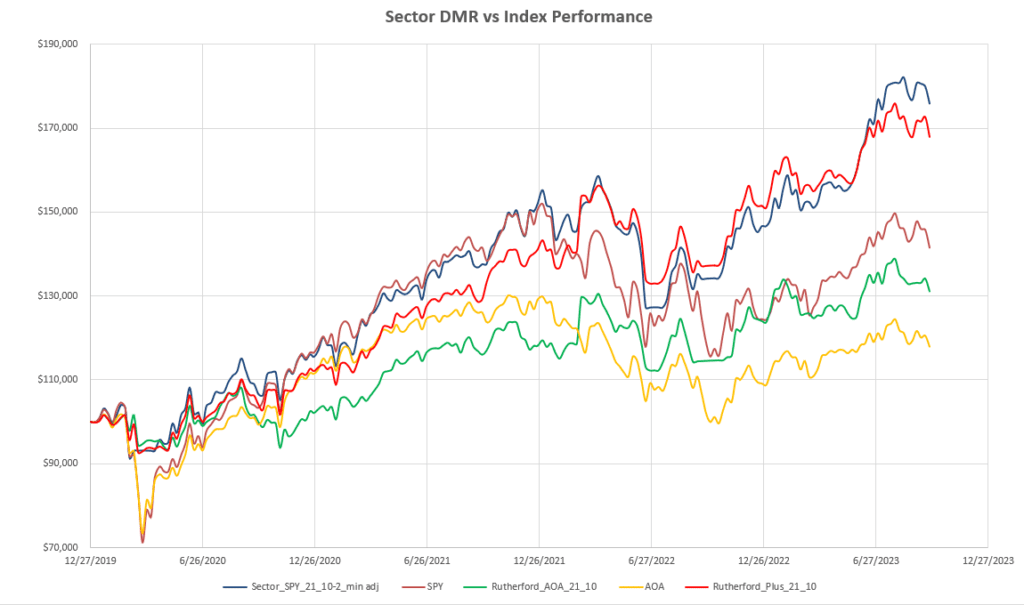
While we do not quite manage to outperform the performance of the SPY Sector Portfolio over this 3 ¾ year period we come very close to matching it and there are periods where the more diversified portfolio generates slightly lower or slightly higher returns and the equity curve is consequently much smoother.
Removing the SPY Sector and Rutherford Tests we see the following comparison with the benchmark Buy/Hold performance:
Ok – so the skeptics are (rightly) saying – “is this just luck or an example of cherry picking?”. Well, I can’t rule out the “luck” aspect because, as regular readers will know, I rank review date (timing) luck as the most significant factor impacting portfolio performance – irrespective of the system used – and I have demonstrated this over the past few years through my posts on the Tranched Rutherford Portfolio. However, to avoid (or at least minimize) the impact of timing luck I have adjusted these portfolios on a weekly review basis with the constraint that existing positions are only adjusted if a 20% variation in fund allocation is called for – this restrains the level of trading (and associated trading costs) to reasonable levels. The time period chosen is not cherry picked – but simply reflects recent market conditions that include examples of (fast and slow) declines/advances as well as longer term sideways movement. Also, I tend to use backtests to show why an idea may not work, rather than trying to prove that it does. I also shy away from the (obvious) temptation to use backtests to “optimize” parameter values – in the belief that a “robust” system should not be overly sensitive to parameter values – just sensible, based on the objectives/goals of the system. In the DMR system used above I only have one selectable parameter – a single look-back period – and this is set at 21 (trading) days/periods. I have not tried testing it using other look-back periods.
As a final note, and to address the question of mean reversion vs momentum systems, as described at the beginning of this post, I have also taken Lowell’s Carson Portfolio (the best performing BPI Sector Portfolio):

that Lowell manages using a mean reversion system – and run a DMR backtest, over the same period of time as Lowell’s posted data, from the beginning of 2022, through the 2022 bear market and to the current/most recent date. My only change here was to remove SHV from Lowell’s investment quiver. The reason for this is that SHV and BIL are very similar assets with extremely low volatility – and only used as a placeholder for Cash when more volatile assets are not being recommended for purchase. Since I am using Risk Parity fund allocations, including 2 similar (extremely) low volatility funds distorts these allocations. BIL has been used as the base for establishing “absolute” momentum in the above back-tests but SHV could equally as well have been used.
This is a very short period of time, but, for what it’s worth, here’s what the performance looks like:
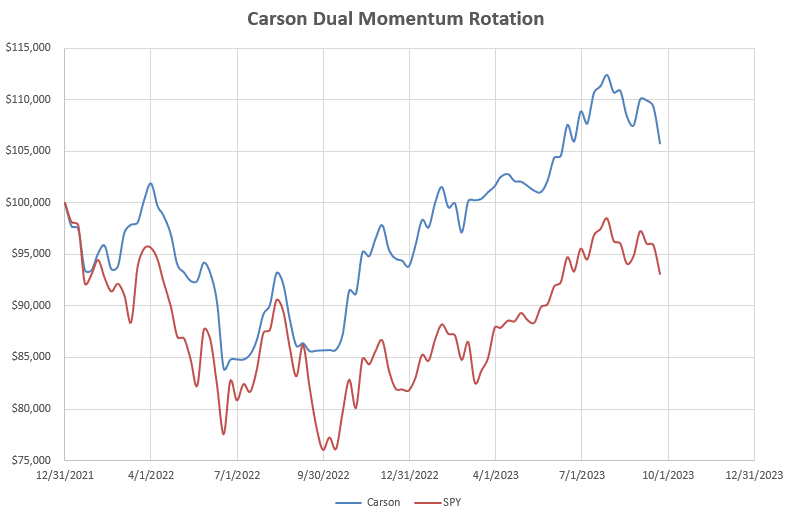 i.e the DMR model has stayed well ahead of the benchmark (SPY) over this period, and the final total return number, ~5+%, is very close to Lowell’s reported return numbers for the BPI model – so both mean reversion and momentum systems can work successfully over certain time periods.
Conclusions
There are many lessons to be learned/things to be considered from the examples provided in this post:
- Pros and Cons of Diversification vs specialization/focus;
- Choice of system/model to use is probably not as important as staying consistent with a proven system.
- In system development, simpler is often better, but attention to detail is important.
Discover more from ITA Wealth Management
Subscribe to get the latest posts sent to your email.
David,
I expected to see a number comments to this thoughtful post. I do have a question or two. As you likely know, I’ve always been skeptical of back-testing while recognizing it is the best method we have for examining various investing models.
I’m interested in how you back-tested the Carson portfolio as there are hidden variables that would make it impossible for me to back-test the Carson. Here are a few examples.
1. When setting up a Bullish Percent Indicator graph, what is the Reversal percentage.
2. What is the Box percentage value. #1 and #2 are values only known to the person who establishes the BPI settings and both of these will impact the Buy and Sell signals of the sector ETFs.
3. Most portfolios are not stagnate. Dollars flow in and out of a portfolio and back-testing never accounts for these transactions. This is where the Internal Rate of Return (IRR) calculation becomes so enlightening. Money flowing into the Copernicus is the primary reason as to why it is performing so well. Those added dollars purchased equity shares at lower prices during the 2022 market dip. Money flowing in and out of a portfolio fouls up back-testing results.
4. Back-testing does not account for shares either purchased or sold using limit orders. Most portfolios do not function on end-of-day prices as is the case with back-testing.
5. Getting back to the Carson, sector ETFs were sold using different Trailing Stop Loss Orders (TSLOs).
6. Another possible variable problem associated with analyzing the Carson has to do with the regularity of checking on the BPI signals. Is it only based on end of week signals or is it based on examining the BPI signals every day?
7. There is always “slippage” when buying and selling securities.
These are a few of the potential issues I have with back-testing.
Other ITA readers may have additional comments.
Lowell
Lowell,
The performance of the Carson asset quiver shown in the above post is simply a backtest applying the DMR (momentum) system/model to that asset quiver. For all the reasons you highlight above, neither I, nor, I suspect, you, can easily back-test your BPI (mean-recersion) system – so the results are not a back-test of the BPI system, just the Portfolio asset quiver, but the objective of the exercise was to demonstrate that, over a reasonable perod of time, both momentum or mean reversion systems, if properly managed, can be ~equally effective and generate acceptable positive returns from the same list of assets..
For the DMR tests reported in the post it was assumed that orders were filled at End-Of-Day (EOD) prices (in reality fills might be better or worse – so we assume that these might cancel/average out) and that the portfolio was reviewed weekly (hopefully to minimize the impact of review-date “luck” – BPI data is not required/used).. It was also assumed that no deposits/withdrawals were made to the portfolio in the time period of the tests.
So, I realize that it isn’t a great comparison (hence why I commented “for what it’s worth”), but it was a simple attempt to convey the fact that different systems can be used to manage a given set of assets provided that the system chosen is sensible and appropriate to the goals and objectives of the investor.
David