Mammoth Hot Springs – Yellowstone National Park
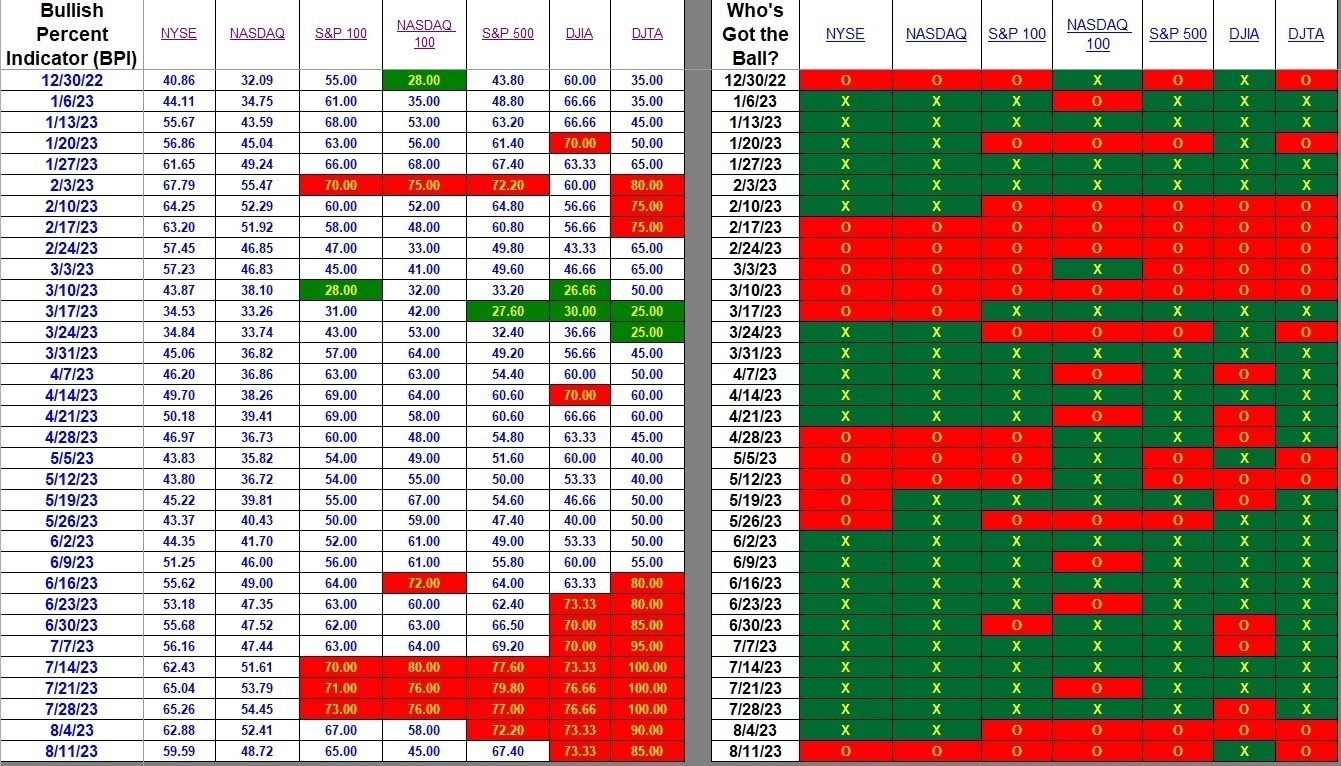
There are few surprises within the Bullish Percent Indicators this week. If your intuition is telling you this was not a particularly good week for stocks, you are correct. Large-cap stocks held up rather well as you can see from the two Dow averages. Small- and mid-cap stocks tailed off based on data from the NYSE and NASDAQ.
Investors managing Sector BPI Plus portfolios will not find any changes as no sectors are flashing a Buy signal and all TSLOs for sectors overbought we set a few weeks ago.
Index BPI
Of the major indexes, only the Dow Jones Industrial Average (DJIA) is bullish – a flip from last week even though the percentage of bullish stocks did not change. This happens when there is some movement during the week as the following table only records data at the end of the week. All of the other major index are bearish. Check the percentages on the left and you will see every index with exception of the DJIA dropped this week.

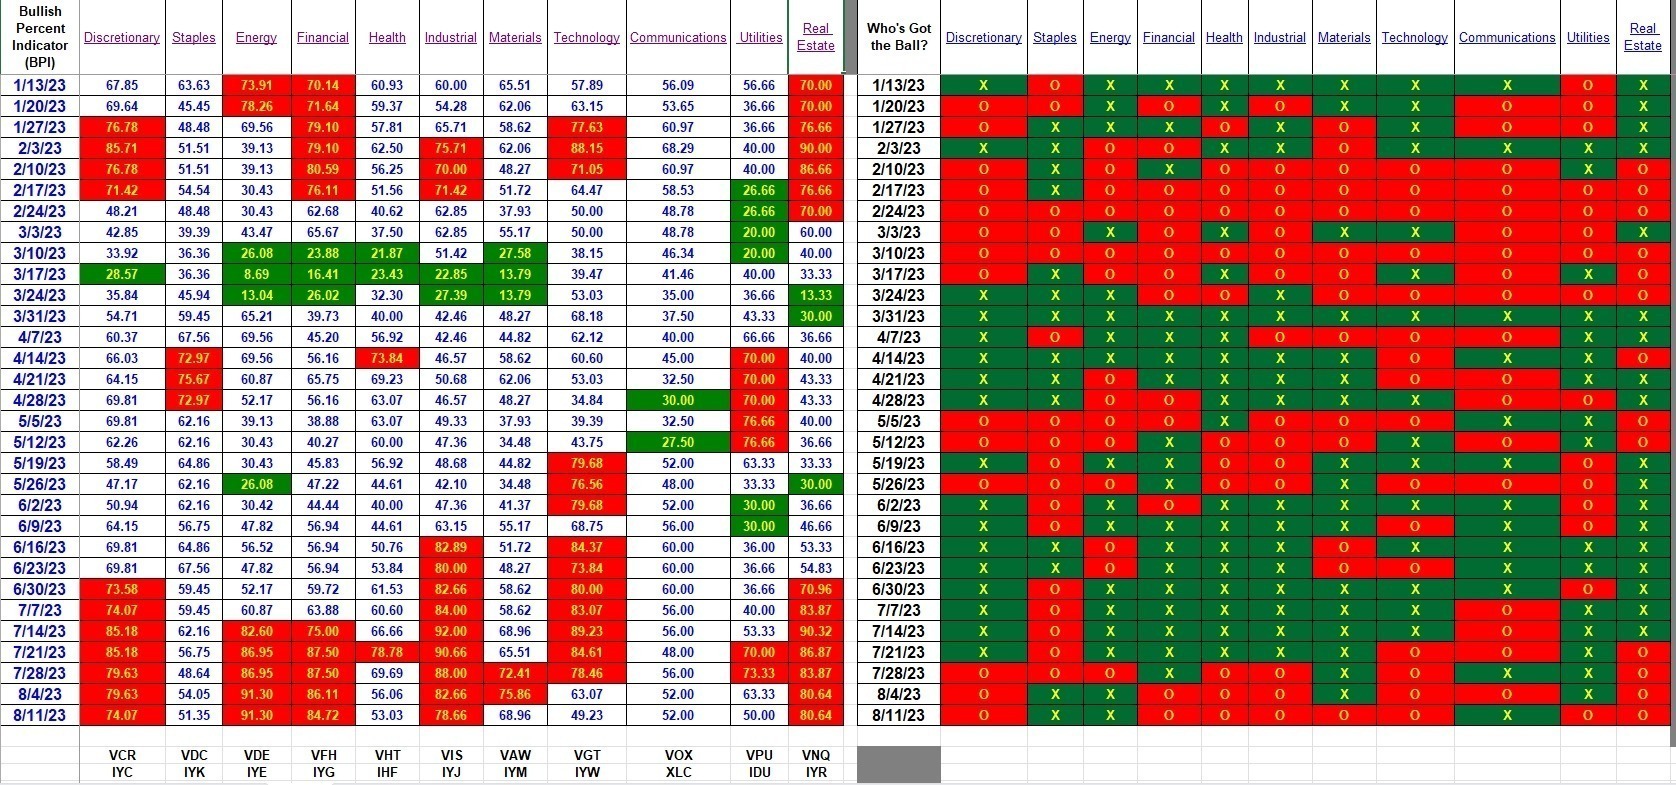
Sector BPI
The following table is the go-to source of information for managing the sector portion of the Sector BPI Plus portfolios. No sectors are oversold so there are no Buy recommendations. Discretionary, Energy, Financial, Industrial, and Real Estate continue in the overbought zone. TSLOs are in place for all of these sectors as well as Materials. If I recall correctly, VPU, VDE, and VFH were sold out of a number of the Sector BPI portfolios over the last two week, thus locking in profits.
VGT and VPU took big hits this week. I doubt any of the Sector BPI portfolios I follow are currently holding shares of those two sector ETFs.

Explaining the Hypothesis of the Sector BPI Model
Within the next few weeks I plan to write an update to the current Sector BPI Plus model as the “new” approach includes a few patches of potential weaknesses in the original investing model.
Discover more from ITA Wealth Management
Subscribe to get the latest posts sent to your email.
You must be logged in to post a comment.