Animal hides still hang on the side of house located in Bodie Historical State Park.
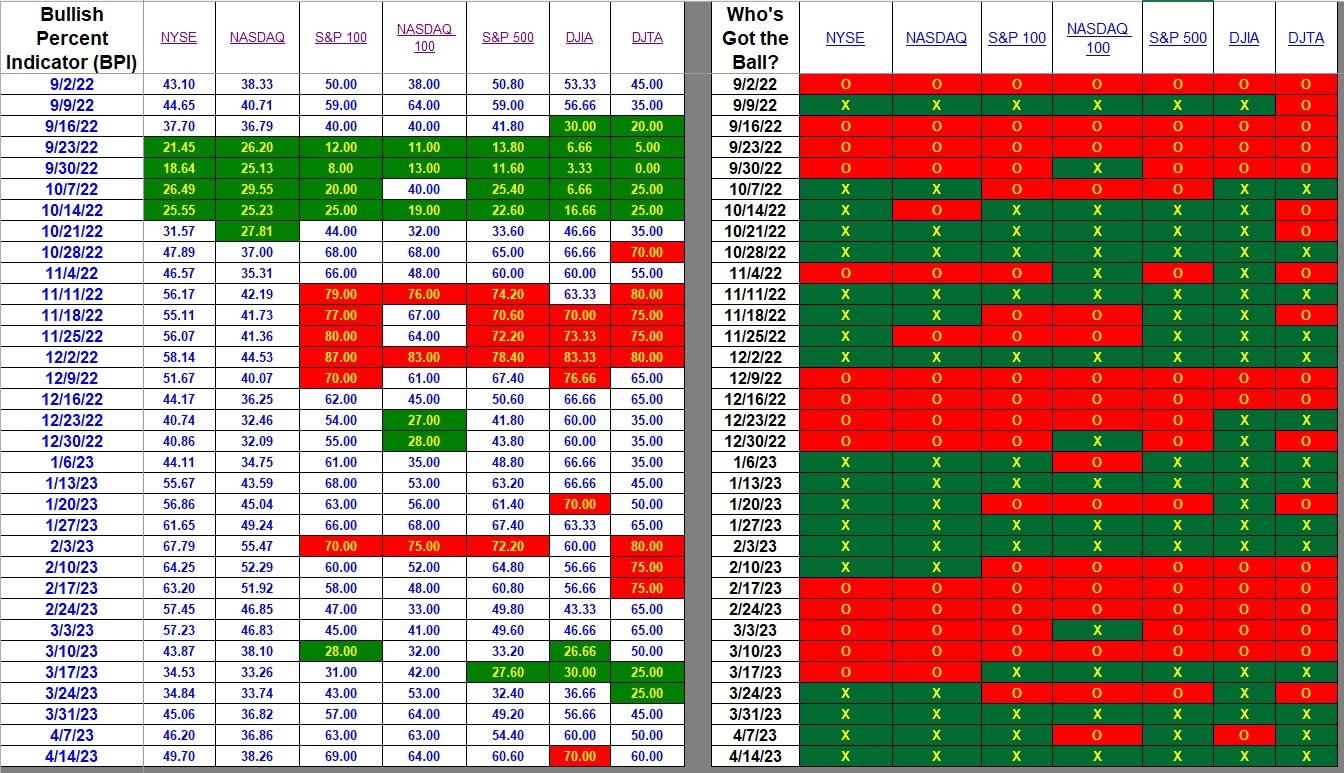
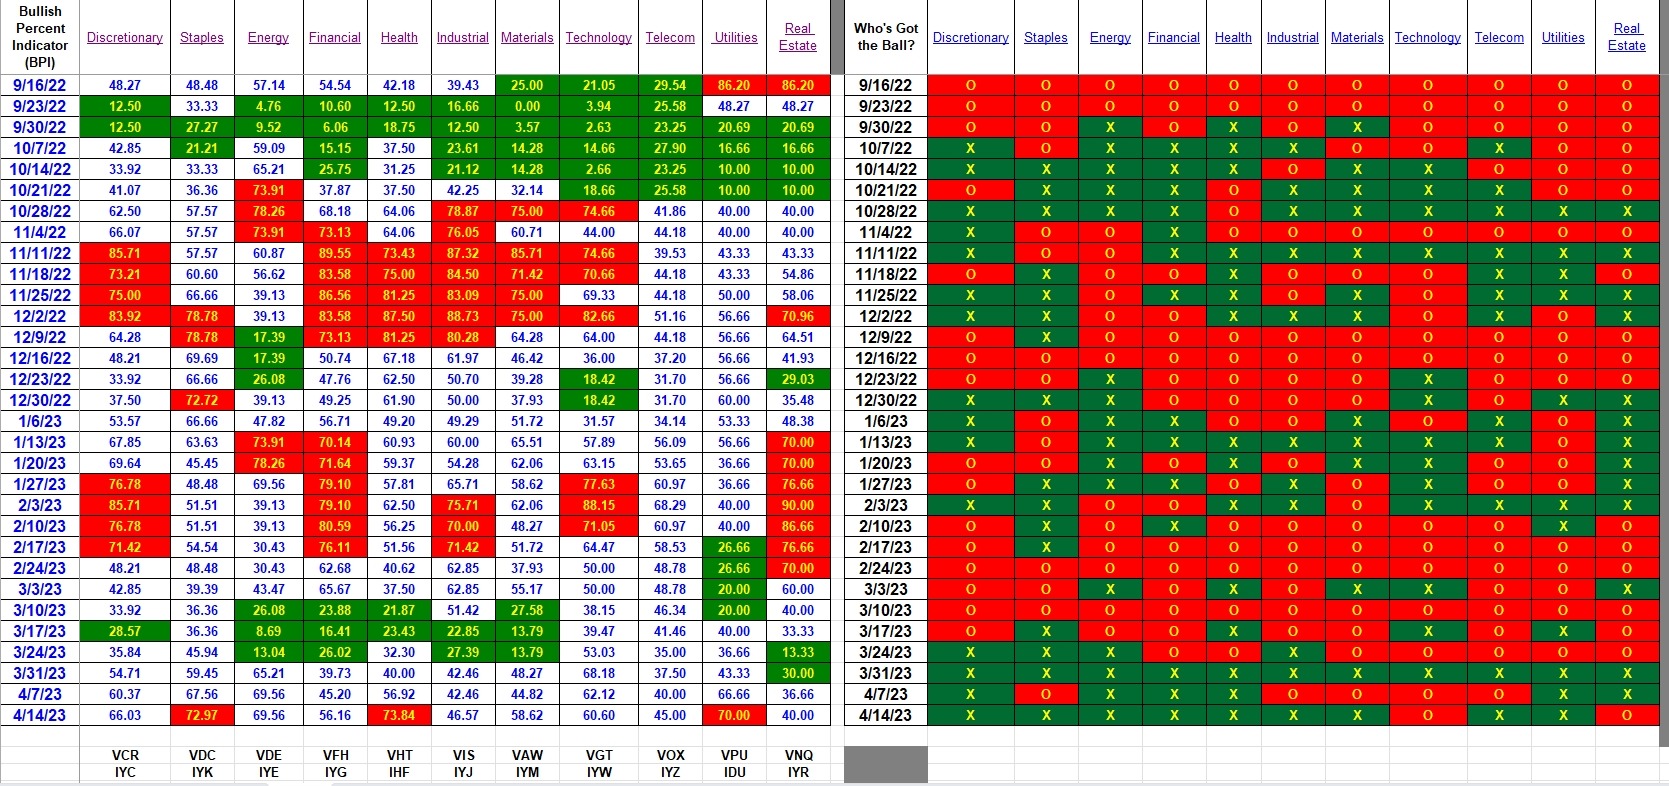
Bullish Percent Indicators this week are bullish when taken as a whole. Investors following or using the Sector BPI model will find three sectors overbought. All the major indexes are bullish with the Dow Jones Industrial Average reaching the overbought zone.
This past week a reader posed a question related to what settings to use for Reversal and Box Percent values. The price of the security is critical as very high prices will have greater dollar swings vs low priced securities. The percentage changes may be the same, but price swings will differ depending on the price of the security. Price is not an issue with any of the following data as all Bullish Percent Indicators remain within limits of 0 to 100 since we are working with percentages rather than the price of the index or sector.
Dorsey recommends using one point per box if the price of the security is between 20 and 100. If the price is between 100 and 200 then use 2 points per box. Du Plessis recommends a 3 box reversal for medium- to long-term investors. I think I mentioned that I have all the BPI chart scaling graphs set to a Reversal (3.0%) and Box Percent (2.0%). I’ve been using these settings since 2005 for the major indexes so I have a long historical record with these settings. The sector data goes back to May of 2012.
Index BPI
Below is the current BPI data for the seven major indexes. I pay most attention to the NYSE and NASDQ. Both are below the 50% bullish level so we can assume the market is slightly oversold.

Credit for the development of the index portion of the BPI spreadsheet, shown above, goes to Bakul Lalla and Saul Seinberg.
Sector BPI
Now we come to the sector BPI data and this is the information we are using to manage the Sector BPI portfolios. If you are holding Staples, Health, and/or Utilities in a portfolio, place a 3% TSLO on VDC, VHT and VPU. Do the same if you are using iShares to populate a sector driven portfolio.
Search Carson, Franklin, Gauss, and Millikan to see how the sector model is working. If you have been keeping up with the most recent blog posts you know that I’m working to patch a logical weakness inherent in the Sector BPI model.
If readers spot other logical weaknesses, please post your ideas in the Comment section provided. Thus far the Sector BPI model appears to be working as laid out in the original hypothesis.

Explaining the Hypothesis of the Sector BPI Model
Carson Portfolio Update: 18 November 2022
Discover more from ITA Wealth Management
Subscribe to get the latest posts sent to your email.
Hi Lowell Reading your piece today reminded me of why I lost patience with Pt/Figure analysis some time ago. Your comments today mentioned that Tom Dorsey recommended using one point per box if the price of the security is between 20 and 100 and if the price is between 100 and 200 then use 2 points per box. Jeremy DuPlessis recommended something else. Suddently the door is open for subjective analysis ( aka Cognitive Biases). The math involved seems simple but it has some nuances that may escape those of us aren’t mathematicians. For physicists such as you and David, the nuances may not be a concern, but I start distrusting things when I have to calculations.
I need simple rules with simple decision points.
The saving grace is you have been using these settings since 2005 for the major indexes and have a long historical record with these settings. That helps me reduce my angst a bit. TX John
John,
As I attempted to explain in the blog post, we need not concern ourselves about price variations as we are always working with PnF data that varies between 0 and 100. Most of the time it is between 20 and 80. Therefore, the box recommendation from both Dorsey and du Plessis align.
The proof will lie in how the portfolios perform. Thus far I am quite encouraged.
Even if one is using the Sector BPI model, I highly recommend also using the Copernicus and Schrodinger models.
Lowell