Another infrared experiment.
Saturday is not a normal day for me to update a portfolio as I prefer to buy and sell securities, if the analysis calls for a change, when the market is open. That is not the case with the Schrodinger as I don’t make the management decisions. Buy and sell decisions are determined by computer algorithms. The Schrodinger is a Robo Advisor account or as Schwab calls these portfolios, “Intelligent Portfolios.” I set this portfolio up years ago for a friend as an answer to the question, “Who will manage the family portfolio when I die?” The Schrodinger is an answer to this question.
The Schrodinger is now nearly seven years old. Instead of going back seven years, I use 12/31/2021 as the launch data since several other portfolios where launched in early 2022 and I prefer to compare the performance of all the portfolios I track on this web site using the same launch or starting date.
Schrodinger Asset Allocation Portfolio
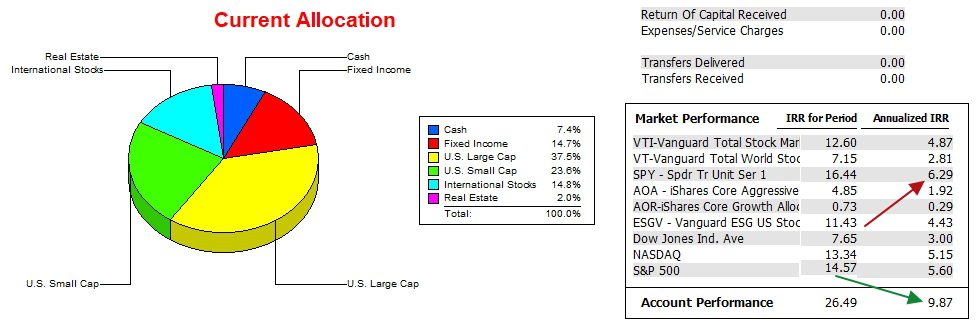
The Schrodinger is housed with Schwab and below is their asset allocation. As I recall, I requested a stock/bond ratio of 80%/20% or a rather aggressive ratio. In reality, equities make up close to 80% while bonds and cash make up the remaining 20%. Schwab tends to carry 7% to 8% in cash. The amount of cash is a bit of a drag in an up market.

Schrodinger Performance Data
Since 12/21/2021 the Schrodinger is outperforming the S&P 500 (SPY) by a significant margin. The gap is even wider when compared with the DJIA and NADASQ indexes. This data comes from the Investment Account Manager, a commercial software program I recommend to all serious investors.

Schrodinger Risk Ratio
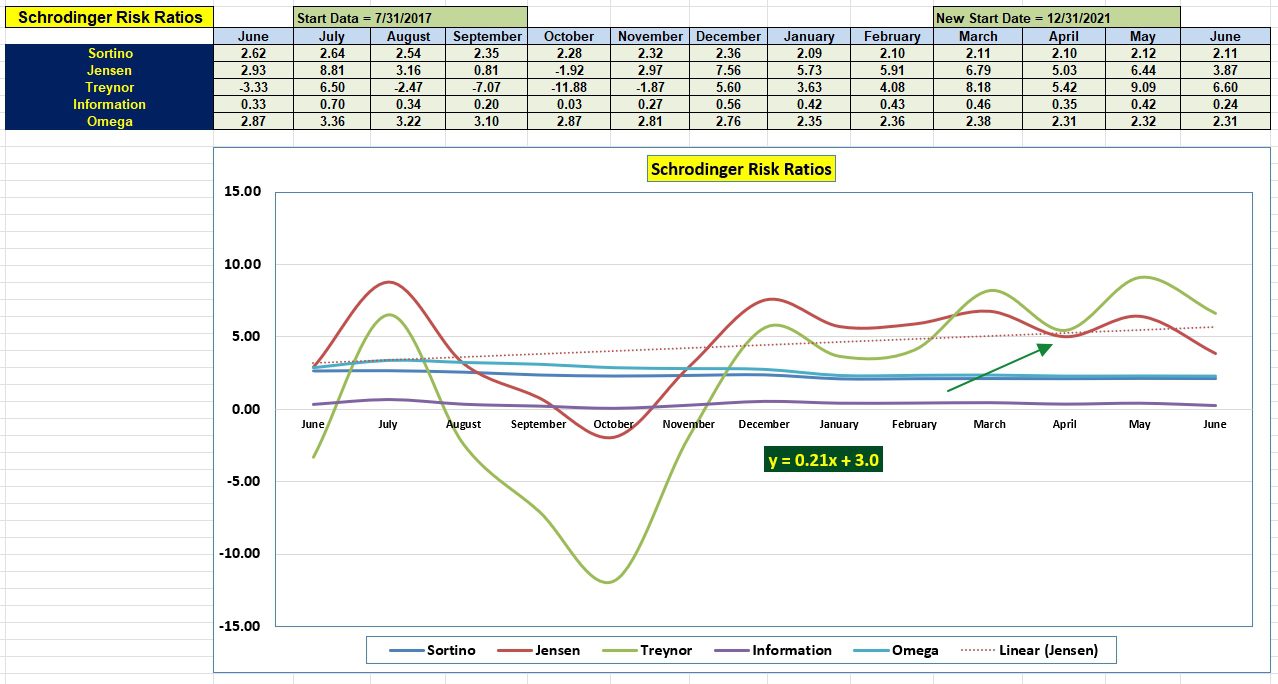
The following table is designed to measure the risk one is taking in the management of a portfolio. Pay most attention to the Jensen Performance Index (frequently called the Jensen Alpha) and the Information Ratio.
Most of values are on par with June 2023 data. The Jensen drop from May to June this year is a bit of a concern. The decline may be attributed to first quarter dividends as not all were reported when I updated this material. Sometimes the ETF dividends for a quarter show up during the first week of the following month.
The good news is the positive slope (0.21) of the Jensen Alpha.
When compared with all 15 portfolio I track, the Schrodinger generally holds down the number 3 spot, only to be pushed aside by the Copernicus and Carson.

For context, here are a few past reviews of the Schrodinger.
Schrodinger Interim Update: 19 October 2022
Schrodinger Computer Manage Portfolio Update: 7 June 2023
Discover more from ITA Wealth Management
Subscribe to get the latest posts sent to your email.
Leave a Comment or Question