Fido waiting for master to drop ballot in drop box.
Carson is the oldest Sector BPI portfolio with a history of two years. During this period there were a few buy/sell cycles, but insufficient to conclude this investing model merits anything other than “experimental” money. The idea of buying when a sector is oversold and selling when the sector is overbought makes a lot of sense. When cash is available one invests in VOO or VTI so as to prevent the market walking away to the upside.
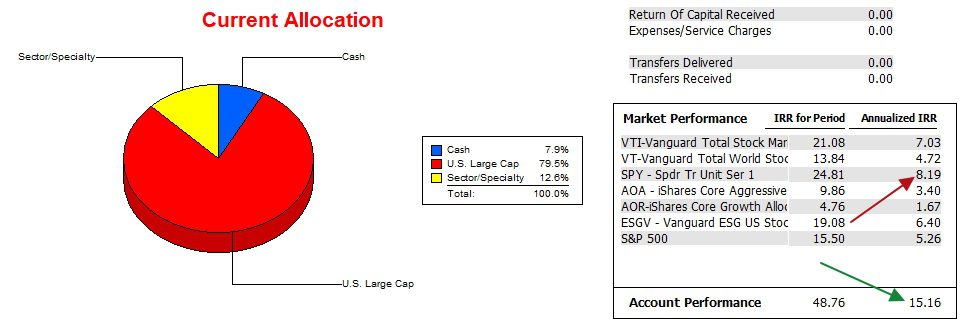
The benchmark for Sector BPI portfolios is the S&P 500 index or SPY. Right now the managers of SPY are outstripping the index by a significant amount. Check the middle screenshot.
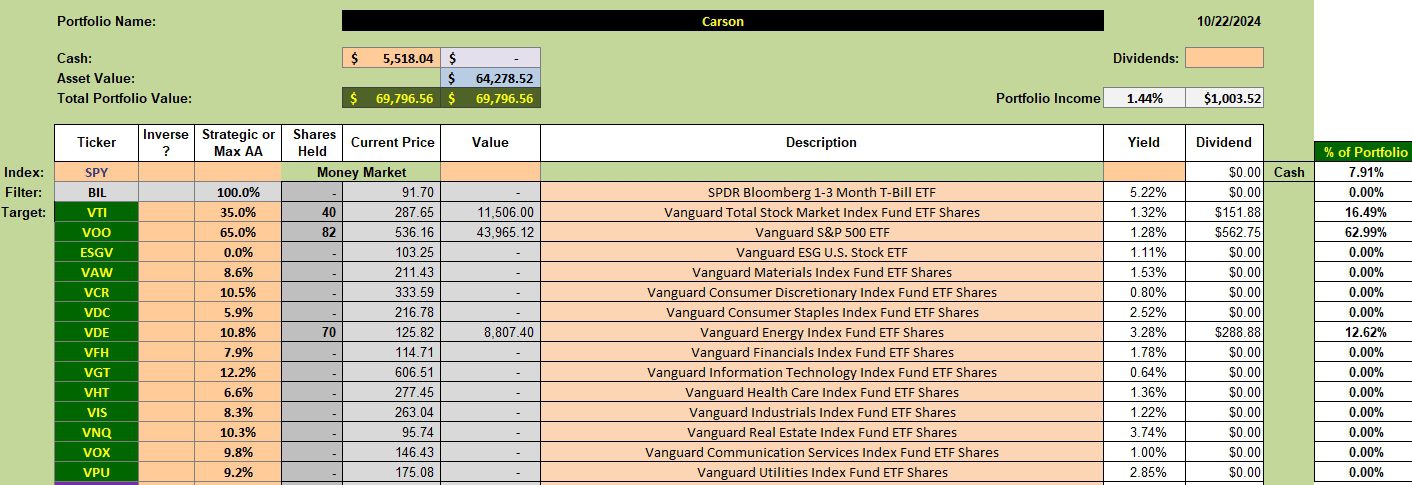
Carson Security Holdings
Below readers find the current makeup of the Carson. Energy was the most recent sector to drop into the oversold zone and has yet to move above the 70% bullish mark when looking at the Point and Figure (PnF) graph for this sector.
I have several limit orders in place to purchase more shares of VOO and VTI. Rather than set limit orders, I likely should have purchased at market. One reason for not doing so is related to the uncertainty linked to the coming U.S. election.

Carson Performance Data
The Carson continues to outstrip all possible benchmarks by a wide margin. The following data runs from 12/31/2021 through 10/22/2024 or nearly three years.

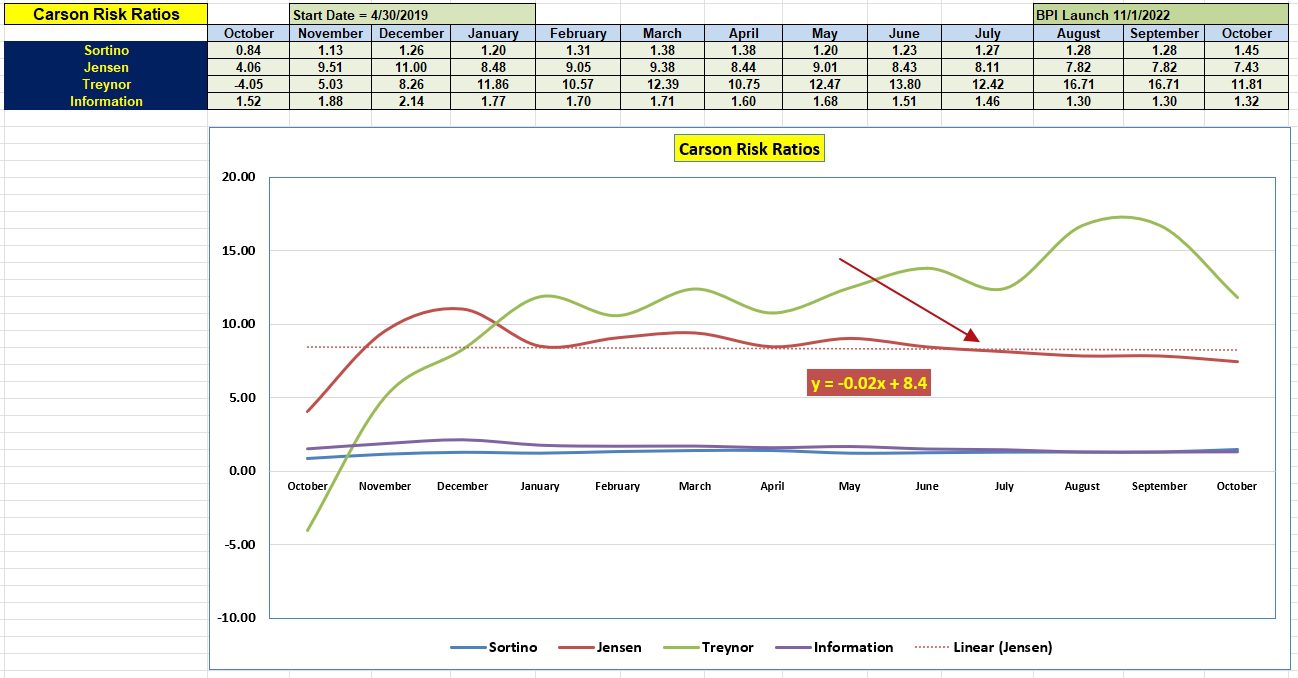
Carson Risk Ratios
The Sortino Ratio indicates the value of the portfolio is increasing. However, the Jensen Alpha shows the Carson is not keeping pace when risk enters the equation. Part of the decline is related to the very high value (5.14%) for the risk-free interest rate on short-term treasuries.
Another reason for the Jensen slope decline is the large holding in cash. If the market moves up and the portfolio is holding cash, the Jensen Alpha value is likely to decline. Once the election is history a new path can be planned.

Gauss Sector BPI Portfolio Update: 3 January 2024
Discover more from ITA Wealth Management
Subscribe to get the latest posts sent to your email.
Leave a Comment or Question