Backyard Clematis
Copernicus is an example portfolio designed for young folks who have little or no time to manage an investment portfolio. All that is required is to open up a broker account, set up monthly deposits, and then log in and purchase shares in one or more of the tickers found in the following investment quiver when cash is available. If four ETFs are too many limit it to VTI and VOO. As for the Copernicus, when new cash is added or dividends declared, that cash is used to purchase shares of VOO. ESGV and SPY are oversubscribed so I will begin to build or increase percentages of VTI and VOO.
The philosophy behind this portfolio is to save and never sell unless there is an emergency. Buy more shares when the market dips. By not selling this is a tax efficient portfolio. If you have cash that has been taxed, invest in a Roth IRA. The key idea is to save and let the market do its work. Don’t tinker with the investing model. If this style portfolio is too aggressive, then seriously consider following either the Schrodinger, Huygens or Pauling portfolios. Huygens and Pauling are new investing models for ITA, but Asset Allocation has a long history as an investing model. Search Schrodinger for an excellent example of Asset Allocation investing.
Copernicus Investment Quiver and Holdings
The following worksheet is available in the Kipling spreadsheet. When one compares the percentages in the far right-hand column with the third column from the left we see ESGV is far out of balance. Since all four ETFs are U.S. Equity securities there is a lot of overlap in the stocks found within each security. This is why I am not overly concerned about the imbalances. For each $500 addition I plan to add a share of VOO.

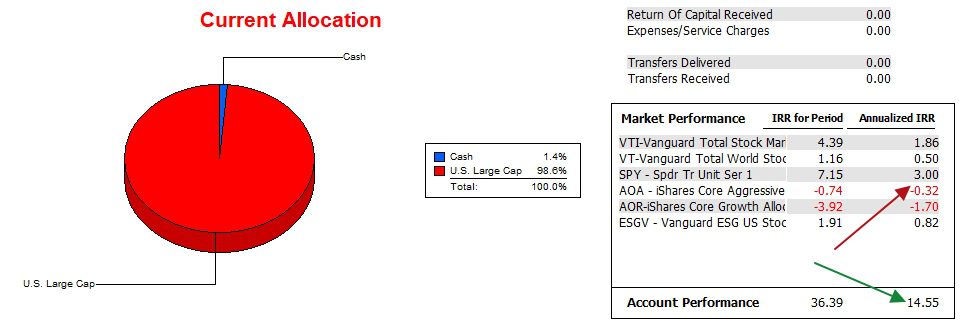
Copernicus Performance Data
The Copernicus continues to hold a substantial lead over the SPY benchmark although the benchmark closed the gap during the month of April. Note how well SPY is performing compared to VTI and ESGV, two other U.S. Equity ETFs. The race is not even close when compared with AOA and AOR.
This data begins on 12/31/2021 and runs through 5/1/2024.

Copernicus Risk Ratios
While most of the risk ratios are higher than they were a year go, the down market in April was a negative for the Copernicus portfolio. When the U.S. Equities market is in decline, as is currently the situation, if possible add more cash to the portfolio and pick up shares of VTI and VOO at lower prices.
The slope of the Jensen Alpha is flat. By the end of the year we hope to see a positive value in excess of 0.1. Until we are past the dog-days of summer and the fall election, I anticipate a rather flat market.

Copernicus Portfolio Review: 29 December 2023
Pass this link on to your friends and relatives. Tell them to register as a Guest and wait to be elevated to the Platinum level so they can read all the blog posts.
Discover more from ITA Wealth Management
Subscribe to get the latest posts sent to your email.
Leave a Comment or Question