Carlson’s general store in Brownsville, OR
As bees are drawn to honey, there is little not to attract investors to the Copernicus portfolio. It is easy to manage and performance is outstanding. The one reservation I have is that there is no downside protection as this is a buy and hold portfolio. As an owner of this type of portfolio one could easily place fresh TSLOs under each of the holdings every time the portfolio is reviewed. Set new or fresh TSLOs if the market is moving higher and if it dips leave the original TSLOs in place. This is one way to insure protection of capital.
The downside to setting TSLOs is that one “breaks” the power of compounding as there is always the danger of getting caught in a market whipsaw. As stated before, the Copernicus is a portfolio for the young with a long saving future.
Copernicus Security Recommendations
Below are the securities I am using with the Copernicus. Based on current prices ESGV is the first ETF to be filled, followed by VOO and VTI. If I had set the Maximum Number of Assets to be included to four (4) SPY would also show up as a Buy. When you see a Hold? recommendation, the decision to hold or sell is up to the manager of the portfolio. With the Copernicus I will always hold.
I should add that the Copernicus is a tax efficient portfolio as we do not sell securities so we are not paying taxes on gains. Yield is modest so we do pay taxes on that income.

Copernicus Manual Risk Adjustment
When working with the Manual Risk Adjustment worksheet the first thing I do is adjust the SD Multiplier so the Stop Loss percentage for VTI is 8.0%. Then I work with the Maximum Portfolio Risk percentage as I prefer this not be too high. Note that it is 8.0% in this screenshot.
In the Shares to Hold column I see where ESGV and VOO are both oversubscribed or already hold more shares than recommended. While VTI holds rank #3 I use available cash to purchase more shares of this ETF. After the market opens this morning I will set a series of limit orders to use available cash to purchase 24 shares of VTI.

Copernicus Performance Data
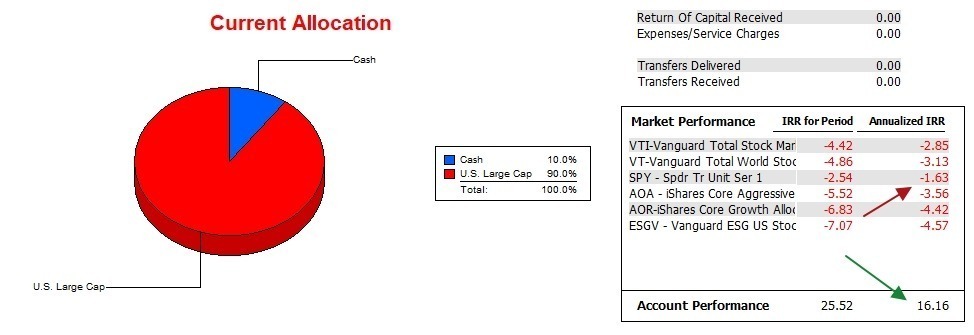
Over the past 19 months the annualized Internal Rate of Return (IRR) for the Copernicus is 16.2% while the SPY benchmark is a negative 1.6%. Readers will remember that 2022 was a down year for U.S. Equities. During that period the owner of this portfolio continued to save and that cash was invested in U.S. Equities ETFs at lower prices. This is the beauty of dollar-cost-averaging and it is paying off now that the market is much higher.

Copernicus Risk Ratios
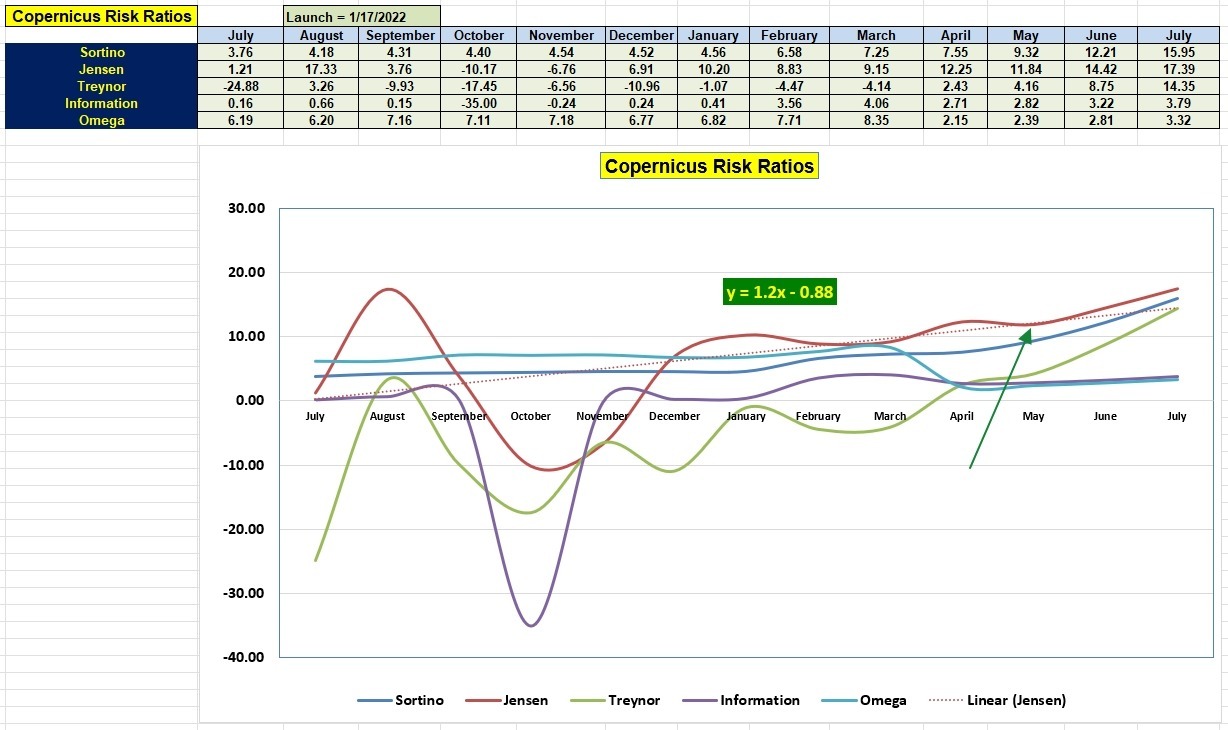
The strong performance is reflected in the critical risk ratios shown below. Pay most attention to the Jensen Alpha and Information Ratio. Both values hit new highs in July.
If you check back to October of 2022 the picture looked anything but rosy for the Copernicus. This is where patience is required for this investment style.

Note: The ITA Wealth Management blog is free to all who register as a Guest. Send the link ( https://itawealth.com ) to your friends and family if they have an interest in investing and are saving for their retirement years. It is never too early to begin a solid retirement program.
Discover more from ITA Wealth Management
Subscribe to get the latest posts sent to your email.
You must be logged in to post a comment.