Wooden Boat leaving for Puget Sound.
Franklin (named for Rosalind of DNA fame) is the portfolio scheduled for an update this morning. Moments ago I checked the latest Sector BPI data and Utilities (VPU) remains in the overbought zone. The recommendation is to place a 3% Trailing Stop Loss Order (TSLO) under VPU, assuming investors are holding that ETF in their Sector BPI portfolio. No BPI sectors are in the oversold zone so there are no Buy recommendations.
At the bottom of this blog post is an example output when Bard is asked the question – Create a blog post explaining Sector Bullish Percent Indicator investing.
Franklin Sector Recommendations and Holdings
The following table lays out the investment quiver for the Franklin portfolio and the current holdings. In the second column from the right readers will see the actual percentage invested in each ETF. Compare that percentage with the recommended percentage found in the third column from the left. Most of the sectors are close to alignment with the recommended percentages.
Remember that the Max AA is calculated by taking 0.70 x the three-year volatility of the sector ETF. The more volatile the sector ETF the higher the percentage recommended for investment.

Franklin Performance Data
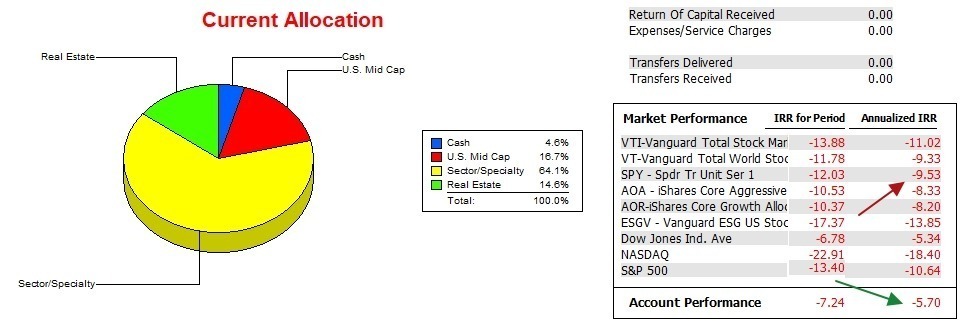
How is the Franklin performing with respect to the S&P 500 over the past 15 plus months? As you can see from the familiar data below, the Franklin, while still in negative territory, holds a commanding lead over SPY as well as most of the other potential benchmarks. Only the DJIA is performing better than the Franklin. The right hand column is an annualized percentage beginning on 12/31/2021 so we have a little more than a year of data. The Sector BPI model of investing is still quite young.

Franklin Risk Ratios
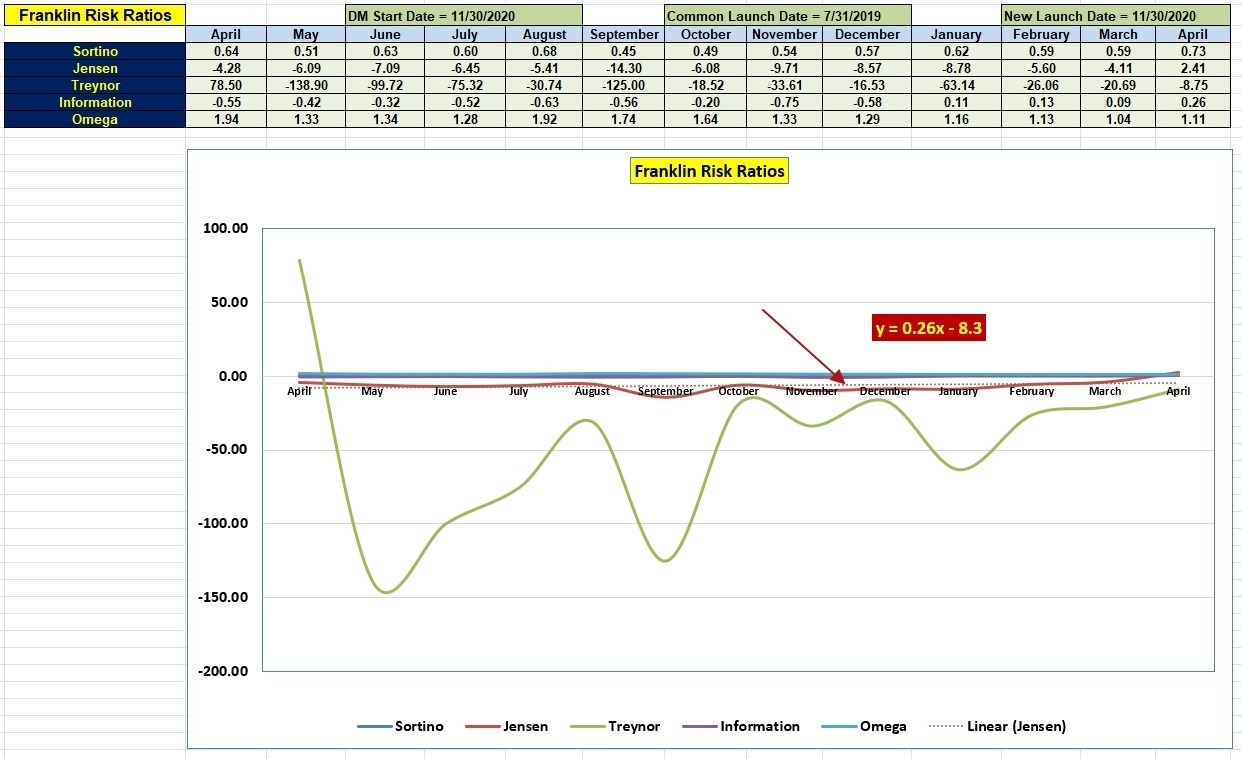
April data, while still early in the month, is showing great improvement in the Jensen Alpha or Jensen Performance Index. This critical portfolio risk calculation is back in positive territory for the first time in over a year. Since moving the Franklin portfolio from the Dual Momentum™ model over to the Sector BPI model the Information Ratio has also improved.
While it is still very early in the game, every indication points toward success for the Sector BPI model.

As a point of interest I asked Bard to write a blog explaining Sector Bullish Percent investing. Here is the output.
Sector Bullish Percent Indicators
“The Sector Bullish Percent Indicator (BPI) is a technical indicator that measures the percentage of stocks in a particular sector that are trading above their 50-day moving average. The BPI is calculated by dividing the number of stocks in a sector that are trading above their 50-day moving average by the total number of stocks in the sector.
The BPI is a valuable tool for investors because it can help them identify sectors that are overbought or oversold. When the BPI is above 70%, it indicates that a sector is overbought and may be due for a correction. When the BPI is below 30%, it indicates that a sector is oversold and may be due for a rally.
The BPI can be used to identify sectors that are ripe for investment. When the BPI is below 30%, it indicates that a sector is oversold and may be due for a rally. Investors can buy stocks in these sectors in anticipation of a rebound.
The BPI can also be used to identify sectors that are overbought and may be due for a correction. When the BPI is above 70%, it indicates that a sector is overbought and may be due for a correction. Investors can sell stocks in these sectors in anticipation of a decline.
The BPI is a versatile tool that can be used by investors of all levels of experience. It is a valuable tool for identifying sectors that are overbought or oversold and can be used to identify sectors that are ripe for investment.
Here are some additional tips for using the Sector Bullish Percent Indicator:
- Use the BPI in conjunction with other technical indicators to confirm signals.
- Don’t make investment decisions based solely on the BPI.
- Consider the overall market conditions before making investment decisions.
- Use stop-loss orders to protect your profits.
The Sector Bullish Percent Indicator is a valuable tool that can help you make better investment decisions. By understanding how to use the BPI, you can increase your chances of success in the stock market.”
While I may quibble with point #2 above, in general this is a good summary of the Sector BPI investing model. Readers who have been following the development of the Carson, Franklin, Gauss, and Millikan portfolios know where a little more “meat on the bones” has been added. Specifics as to what percent to invest in each asset class is explained as well as when and how to set TSLOs.
If you have Questions or Comments, post them in the Comment section provided below.
The ITA Wealth Management blog is now free to all investors who register as a Guest. Pass this information on to your friends and family.
Lowell
Discover more from ITA Wealth Management
Subscribe to get the latest posts sent to your email.
Lowell,
I set a 3% TSOL on all my VPU assets. So far everything is a positive.
Bob W
Bob W.,
Is the TSLO set for VPU your first overbought setting? It is my first TSLO in the Buy-Sell cycle.
As I work with the Sector BPI model I continue to think through market cycles where the model is weak. Once such period is one Jim mentioned in a Comment this morning.
I can envision a period were several sectors move into the overbought zone and are then sold when their respective TSLOs are struck. The ETFs then move down into the neutral zone, only to rise again back into the overbought zone for a long period of time. However, one is now out of the sectors as they never moved down into the oversold zone. This exact market event occurred in 2012 through 2014. To be sitting in a money market or short-term treasury for two years while the market moves higher will test the patience of any investor.
One solution is to use the BHS model at such a time and invest only in SPY or VTI if the BHS model calls for a Buy. Other ideas are welcome.
Lowell
Yes it’s the first buy in this round of purchases. I had a cycle in 2022 of sector purchases that worked well. I thought that was the purpose of setting a TSLO to try and avoid selling too soon. During the 2022 cycle I didn’t use a TSLO for all sectors.
Bob W.
Sorry first sell.
Bob W.
Lowell,
Do you use StockCharts to calculate the BPI’s?
If so, what do you use for “Chart Styles” and “Chart Scaling?” Any particular reason for those settings?
Also, do you use those same settings when evaluating PnF charts for ETFs?
~jim
Jim,
Yes, I use StockCharts for the BPI data.
The settings I use are: Chart Styles is set to Predefined Settings. Chart Scaling variables are: Method =Percentage, Reversal = 3, and Box Percent = 2. I came up with these variables or settings after reading Jeremy du Plessis’ book, “The Definitive Guide to Point and Figure.” I consider it to be the “bible” of PnF graphing. Dorsey is good, but not equivalent to du Plessis.
I don’t pay attention to the PnF graphs for individual sector ETFs as the Buy and TSLO settings are determined by the BPI recommendations.
Lowell
Lowell,
Thanks for the reply. You confirmed what I thought you have been using for settings. You can create PnF charts in both Fidelity and Schwab charts, but as yet I have not been able to figure out how to mimic the StockChart settings.
~jim
Lowell,
In looking up your recommendation on Jeremy du Plessis’ book, I found a newer version copyright 2015. It’s titled “21st century point and figure : new and advanced techniques for using point and figure charts.”
~jim
Jim,
Correct. I have an older version of the Plessis book.
Lowell
I updated the Performance SS and the Franklin moved up to #4 on the analized IRR list and #3 when risk enters the equation.
This is a big jump for a once flagging portfolio.
Lowell
Hi Lowell
I have a question on PnF charts concerning using 1% box size vs 2%. I have been mentoring at the 1% for some time.
Is there an easy explanation for the pro and cons of using the 2% box. In comparing a number of ETFs there are sometime large differences flipping the Price Objective (PO) from positive to negative or from negative to positive.
thanks
Bob
Bob,
This is an excellent question as the settings will result in major changes to the “chart look” and thus the Buy/Sell decisions.
Here I rely on information from Jeremy du Plessis as he has a section on this subject. I’ve decided on the Reversal set to 3 and the Box Percent set to 2%. These are settings that fall into what one might call a medium to long-term investor. A 1% setting is for a short-term trader.
These are personal decisions and one each investor must make. Since I am looking for longer term trends I’m seeking the middle ground where I am definitely not a short-term trader, but don’t want to go so long (5 box for example) that I will miss out on protecting profits or miss critical turning points.
Hope this helps. This not one of those situations where there is a precise answer.
Lowell
Lowell
great answer Thank you
Bob