
Sunset, Krabi, Thailand
US equities continued to confirm their bullish trend over the past week although they could not close above the 4300 mark:
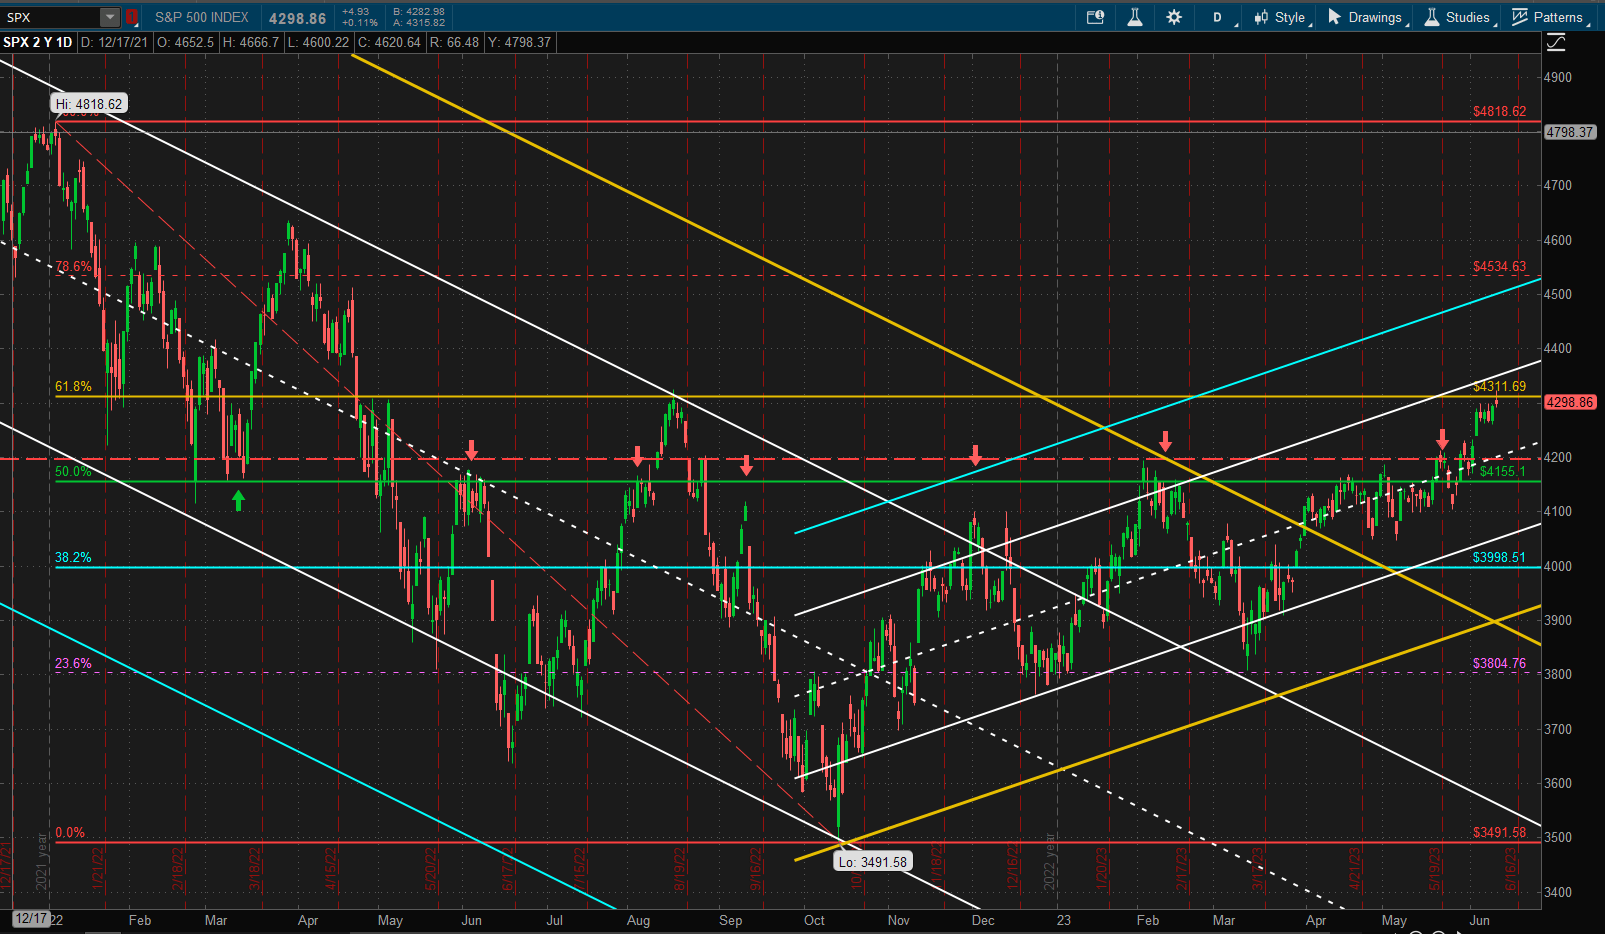 4300 is the 61.8% Fibonnaci retracement level from the October 2022 lows to the prior January 2022 all-time high. It is also a significant area of previous support/resistance – notably the August 2022 attempt to break the previous downtrend.
Relative to other major asset classes US equities continue to show strength:
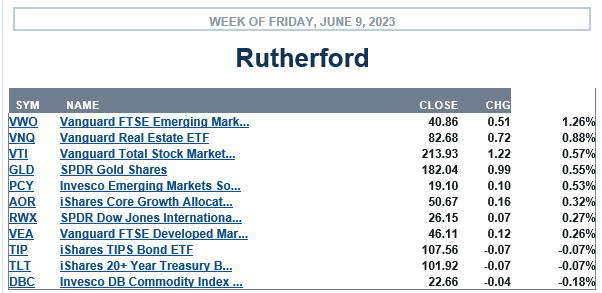 The 4-tranche Rutherford Portfolio presently looks like this:
 with performance keeping pace with the benchmark AOR fund:
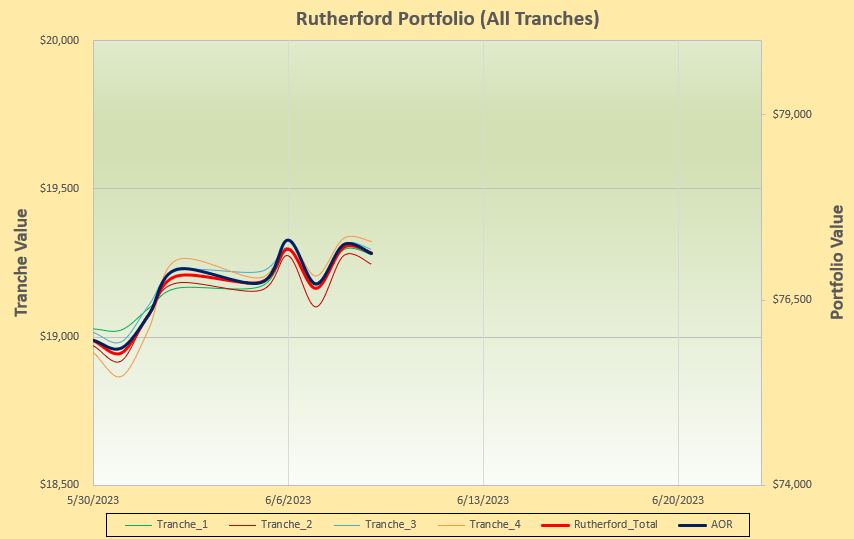 Tranche 2 (the focus of this week’s review) is presently the poorest performing tranche so we’ll take a look at the rotation graphs to see if there might be some adjustments to be made:
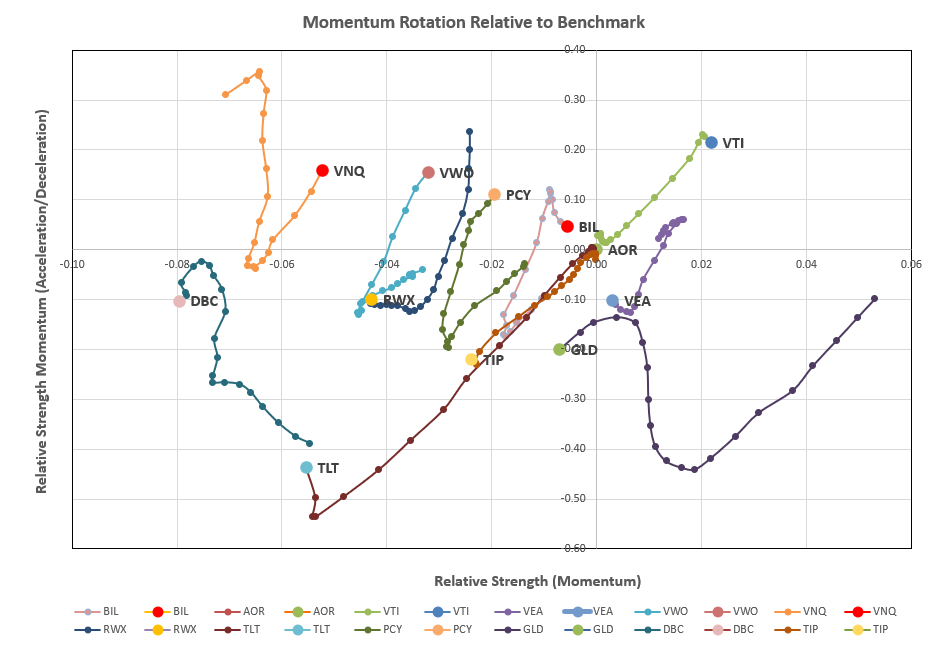 VTI continues it’s rotation in the top right quadrant – but there is a hint that this strength may be weakening in the short term. GLD is rotating into the undesirable bottom left quadrant (weaker short-term and long term strength). A check on recommendations from the rotation model:
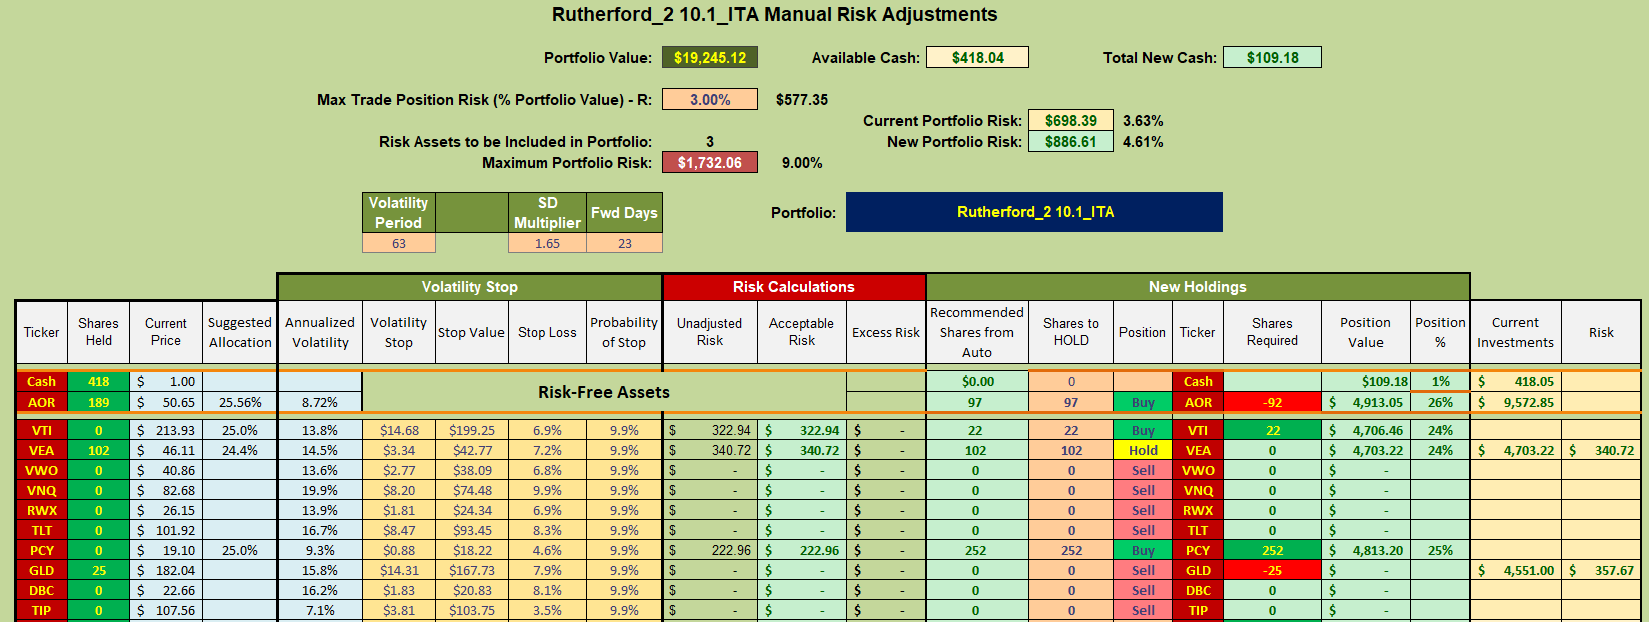
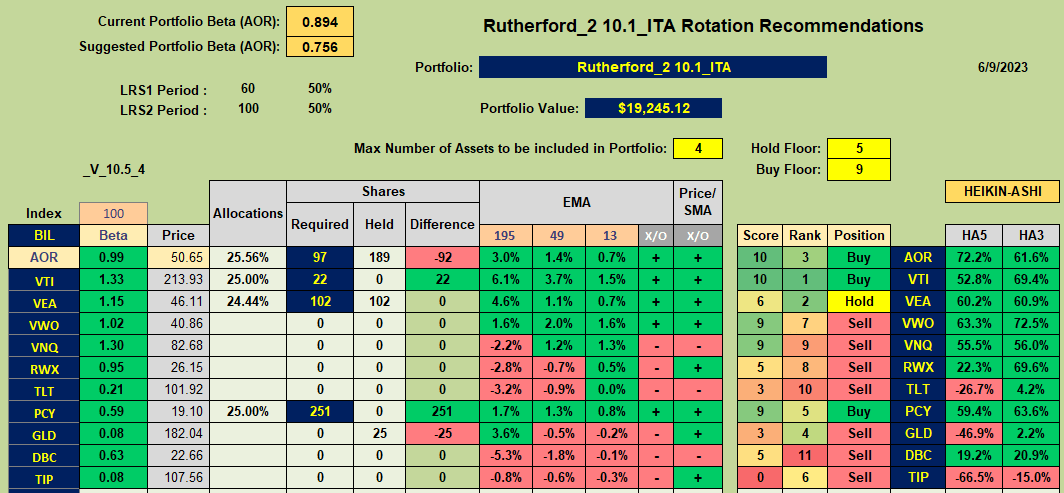 shows Buy recommendation for AOR (the benchmark fund), VTI and PCY (International bonds) and a Hold recommendation for VEA. This requires the Sale of current holdings in GLD and a portion of the shares currently held in the benchmark fund:
Discover more from ITA Wealth Management
Subscribe to get the latest posts sent to your email.
Hi Lowell,
I have a general question and perhaps more philosophical about using technical analysis to make investment decisions. I would think that the utility of technical analysis in the longer time frames is less useful today than it was in the past since it’s so embedded in the market today. It seems like everyone is exposed to it in one way or another. In other words, in the short term it seems to me to be self fulfilling but perhaps less so in the longer run where sentiment and macro events have more influence. Also, doesn’t high volatility make it less predictable?
I would appreciate your opinion if you don’t think it too foolish of a question. Thank you,
Bill
Bill,
I’m not sure this response will accurately answer your question, but I’ll give it a try. When I think of technical analysis I think of investing methods such as the Elliot Wave Theory. Perhaps that is an extreme case. Breaking down the portfolios I track they fall into two major categories. 1) Passive Management and 2) Active Management.
One might equate Active Management with Technical Analysis. There are different extremes of Technical Analysis.
The Schrodinger and Copernicus are passively managed. The Bethe and Bohr come close to passively managed.
The remaining portfolios I watch over are actively managed. I break these down into different groups.
The four Sector BPI Plus portfolios are more trend followers where the goal is to buy low and sell high. Yes, there is an element of technical analysis. The underlying hypothesis is very simple.
The two Dual Momentum portfolios also trend followers, but with a different technical analysis model.
Several portfolios are set up primarily to generate income, a desire of the owners.
Based on the Internal Rate of Return and Risk Ratios data, the top performers definitely tilt toward the more passively managed and the Sector BPI Plus group. It is still too early to match the performance of the Sector group with the Copernicus and Schrodinger, but the early results are positive.
Conclusion: Over the long run, it is extremely difficult to top the S&P 500. As you may recall, Bill Miller was known for besting the S&P 500 for over a decade. Then he fell mightily. This article is one you may find interesting.
https://money.com/bill-miller-fund-manager-legg-mason-fired/
As Artificial Intelligence improves don’t be surprised if more and more money is not managed by computers as is the Schrodinger. I anticipate these computer managed portfolios will gravitate toward the passive end of the investing spectrum.
Lowell
Hi Lowell,
Thank you for your quick and detailed reply to my very general question. I definitely have a better understanding of how the ITA portfolios are managed. I guess my view of technical analysis was too narrowly focused on chart reading. I also appreciate the Bill Miller article reference which was interesting.
As a follow up, could you point me to the ITA areas where I could get some better understanding on how you measure and use Momentum and Risk Ratios. I would greatly appreciate it.
Thanks again,
Bill
Bill,
As for momentum, Gary Antonacci’s book on Dual Momentum is a good start. The book is now on the expensive side. David (Hedgehunter) built this model into the Kipling spreadsheet as well as several other momentum models.
Another use of momentum is to use Exponential Moving Averages (EMAs). I’ve used these for over 40 years and they are very easy to calculate. Here is a link.
https://www.investopedia.com/ask/answers/122314/what-exponential-moving-average-ema-formula-and-how-ema-calculated.asp
The Risk Ratios are a combination of risk measurements I’ve put together so I can measure both performance (return) and what risk I am taking to achieve those returns. The most important one in my evaluation is the Jensen Performance Index or frequently known as the Jensen Alpha. When this value is positive the money manager is adding value to the portfolio. Investopedia has information on the Jensen as well as the Information Ratio, another variable is include in the Risk Ratio data table.
As you know from reading this blog, I’ve become a fan of Schwab’s Intelligent Portfolio. The Schrodinger is such a portfolio. I use this computer managed portfolio as a reference or benchmark for the other ITA portfolios. I hope to post an update of this spreadsheet some time this week and then again after the second quarter dividends are in.
Having stated all the above, don’t get too technical. As I show on this blog, the simple portfolio are among the top performers. It is extremely difficult to top the S&P 500. I am showing this through the Copernicus.
Lowell
Bill,
Yes, this is probably more philosophical than a “best strategy” question.
As “investors” we are paid to take risk – so, philosophically we just need to understand the risk that we are taking and to be comfortable with it and/or learn how to manage it. How we do this may be based on fundamental and/or technical “analysis” – whatever information we have that is available to us and that we think might be useful/helpful.
When I started “investing” (some 50+ years ago) there were no (personal) computers available and I started my technical analysis by checking the newspaper every day and plotting Point and Figure Charts (like the ones Lowell shows from time to time – but he doesn’t have to plot them manually 🙂 ). With the advent of personal computers and availability of data through the internet or service providers we now have easy access to way more (probably too much) information. But we are not the only ones with access to this information – it is available to anyone with an interest in it – so I think we can assume that it’s value is diluted and that the impact is already “baked in” to market prices. Although we sometimes like to claim that the market isn’t very efficient (particularly if we don’t like the Efficient Market Hypothesis) – it really is quite efficient.
However, emotional factors are also now more widely recognized/accepted as signicicant contributors to investment decisions – hence the many references to “behavioral finance”.and (as our in-house shrink, JS, will tell us) the recognition of our cognitive biases.
Back to the simple – we probably invest because of the evidence that, over the long term, we have evidence that (on average) stock prices go up. However, our egos usually tell us that we are smarter and can beat some benchmark that we don’t touch. As regular readers will know – this is not easy to do, at least consistently – over the long term – maybe in the short term – or maybe not 🙂 .
For those of us in (or close to) our retirement years we also become less prepared to take risk since we don’t want to go through a 50% (or maybe even a 20%) Draw-Down. This is where it may help us to look to “technical analysis” for some hints as to what we might do.
If we don’t want to take the downside risk of “Passive” investing, most “Active” investors (at least retail investors) adopt “systems” that rely on some form of trend following or momentum measurement, or, if we’re more contrarian in nature, a mean-reversion system. Of course, these systems are often/usually not complementary and, when one system is “working” the other is not – and we can get impatient/disheartened when were’re not beating our benchmark – and our “behavioral” biases kick in at the worst possible times.
If we can stay cool, it may help us to look at some relatively simple technical analysis “tools” that may at least make us aware of possible “danger areas” where we may/may not want to make investment decisions. Some of my favorites (and these are quite simple – if maybe a little subjective – because this isn’t an exact “science”) are support/resistance areas/zones – where prices have historically found support and/or resistance in the past – (regression) channels – prices tend to trend in these channels for much longer than we might think and (one of my favorite “fun” tools) Fibonacci regression levels (at least the major ones at 38.2%, 50% and 61.8% retracements from prior highs/lows. While I wouldn’t build a “system” around these “technicals” I do think that it’s useful to be aware of where they are and where price lies in relation to them. Maybe we hesitate to buy/sell at/near support/resistance or near channel boundaries or maybe we see these as possible areas to take profits or losses.
That’s my philosophical 2 cents worth 🙂
David
Hi David,
Thank you for your very unexpected and helpful response to my “philosophical” question on technical analysis. It is a refreshing perspective on the whole technical methodology of investing that I need to ponder some more. I guess it’s only human to want definitive guidance which in the short run it somewhat does but then, in the longer run, the fundamentals and our emotions take control.
Also I am intrigued by Fibonacci retracements which have basis in nature. If you have any elementary articles or references you could point me to, I would appreciate it.
Thanks again,
Bill
Bill,
Thanks for your kind comments – there are numerous articles/papers written on Fibonnaci but a simple place to start might be the Investopedia post at https://www.investopedia.com/ask/answers/05/fibonacciretracement.asp . I think this is a very fair and accurate introduction to the usefulness of Fibonacci retracements in trading. Like the unknown reasons for the existance of Fibonacci ratios in nature, there is no scientific reason why they should be present/useful in trading – but (at least with hindsight) we see lots of evidence for them pointing to areas of support/resistance. Of course, their usefulness in predicting future areas of support/resistance is more questionable. Nevertheless, intriguing – maybe the self fulfilling prophecy principle contribututes to this (if enough investors/traders believe in it) – but, then, so be it – it’s still valuable/useful information to know where these areas are/might be.
Let me know if you want any deeper insights – Elliot Wave Theory ties into this in many ways but, as Lowell points out, this is probably a little over-the-top and even more subjective – and I wouldn’t recommend going down that rabbit hole unless you have a really strong desire to do so for whatever reasons. I doubt that it will really help too much in the end.
David