
Botanic Gardens, Singapore
It was a quiet, holiday shortened, week in the markets with the S&P 500 Index drifting slightly higher by ~0.3% toward the all-time highs of 2 years ago of ~4800 in the SPX:
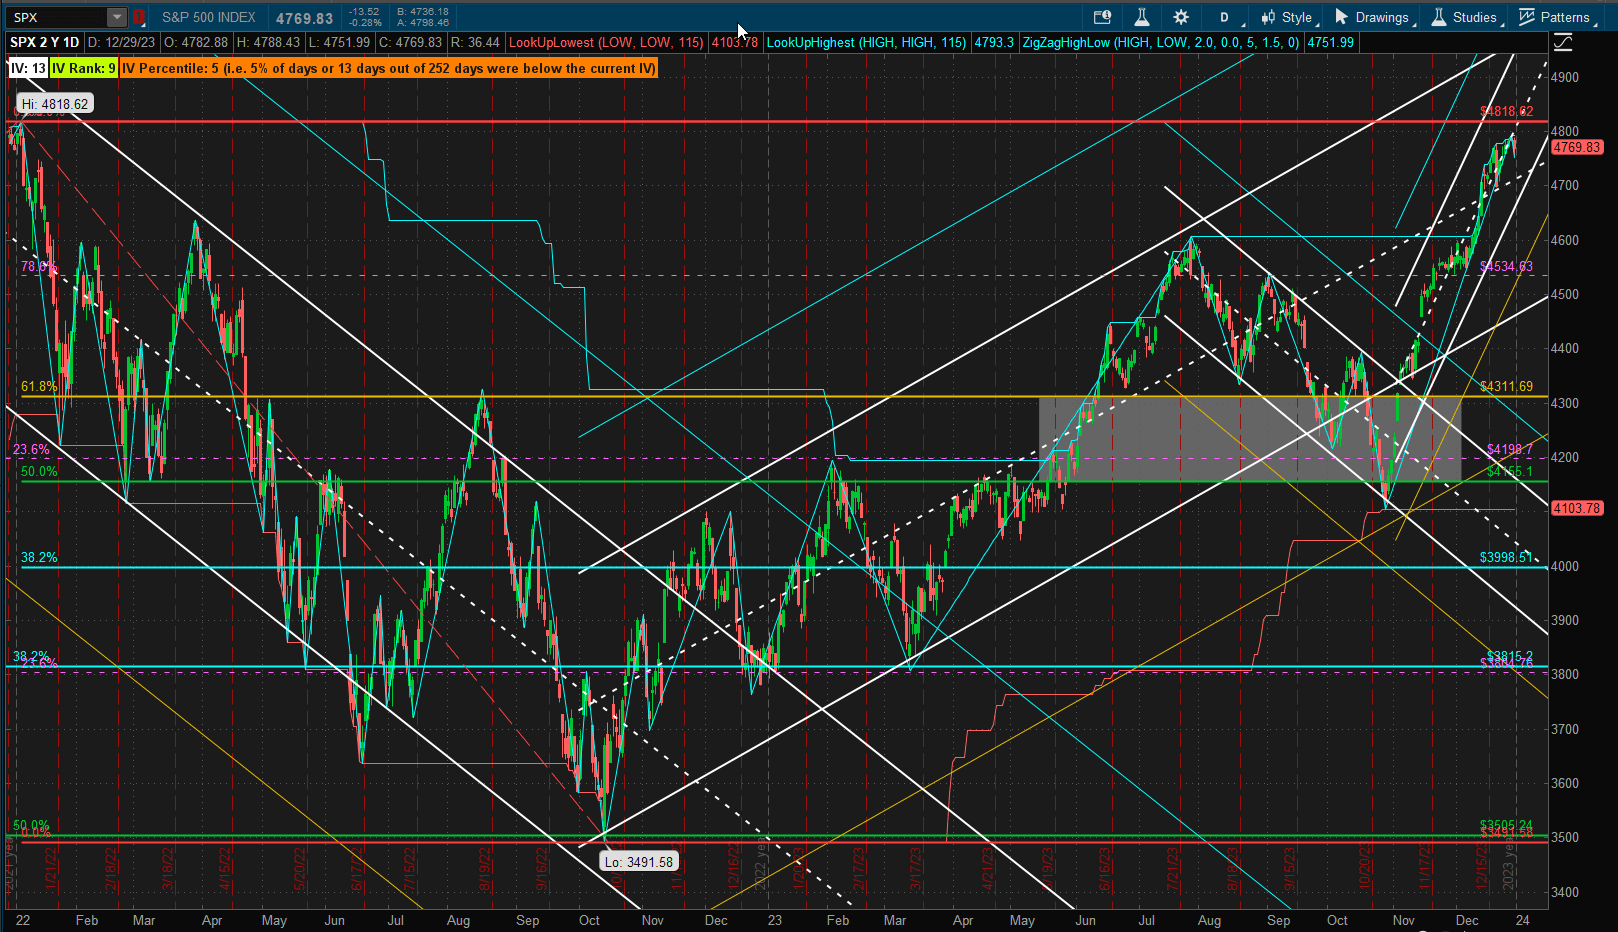 However, Santa could not pull us through the strong resistance at this level and we need to wonder whether he has turned around to head home.
The above chart shows 4 major trends over the past 2 years, although it might be argued that there are only 2 major trends since the last 2 trends to the right of the chart (in 2023) still lie within the 2 Standard Deviation bullish channel that began at the 2023 October lows. The trend channels drawn on the above chart are based on breakouts of the 1 Standard Deviation channels that investors concerned with risk and presevation of capital may be more focussed on.
Compared to the performance of other major asset classes last week:
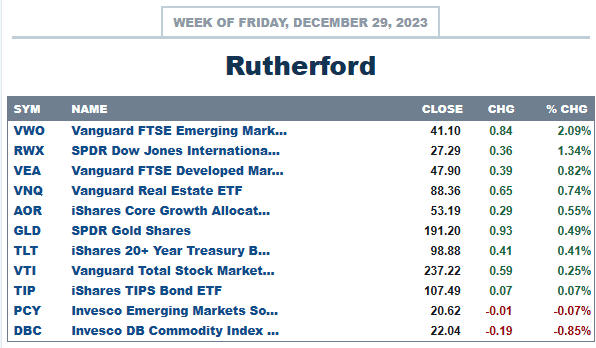 US equities fared “average” with International equities and Real Estate all performing better.
Current holdings in the Rutherford Portfolio still look like this:
 since I was, again, too pre-occupied with other things to find the time to make any adjustments. However, performance was still acceptable since the portfolio is well diversified and defensive in that 40% is still held in BIL (as a proxy for Cash):
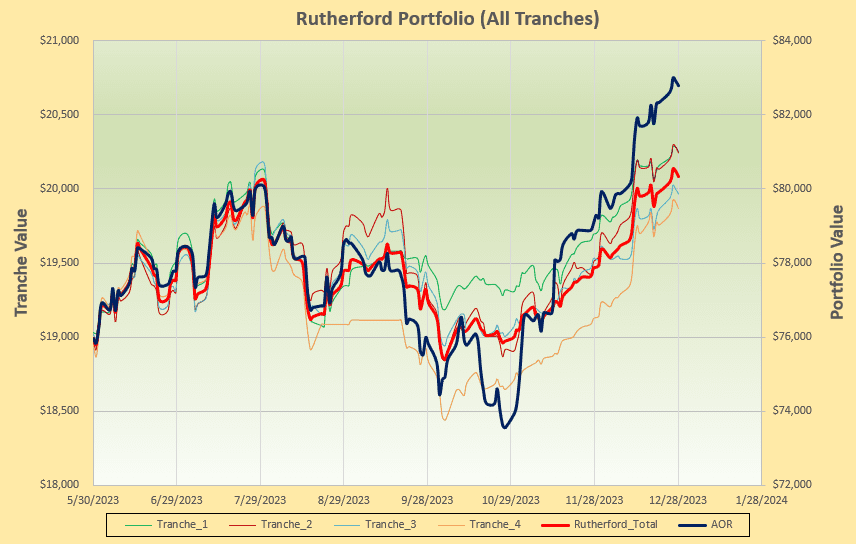 Checking on the rotation graphs:
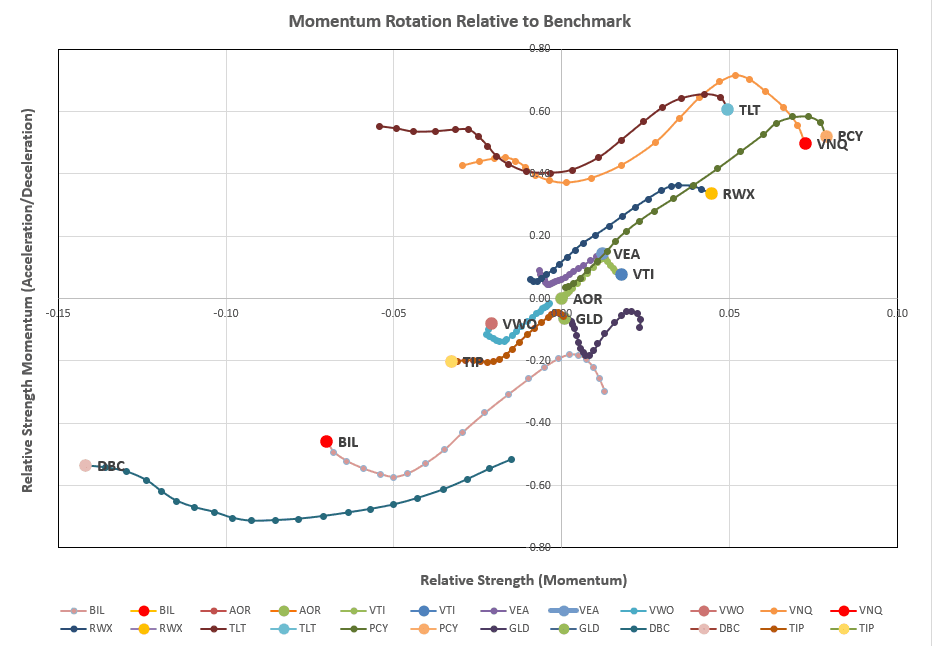 we see a continuation in the strength of a number of ETFs that are lying in the desirable top right quadrant but, maybe, with a warning that this strength is weakening or at least slowing down (downward vertical movement).
This week’s recommendations from the rotation model look like this:
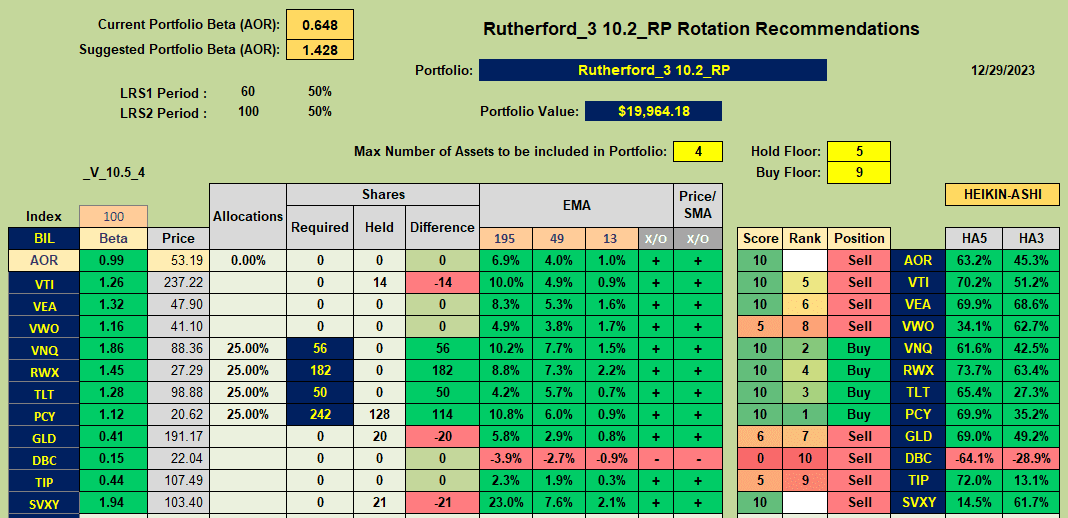 with Buy recommendations for VNQ, RWX, TLT and PCY. It may be significant that none of these ETFs represent the equity markets.
Following the above recommendations, this week’s adjustments for Tranche 3 (the focus of this week’s review) look something like this:
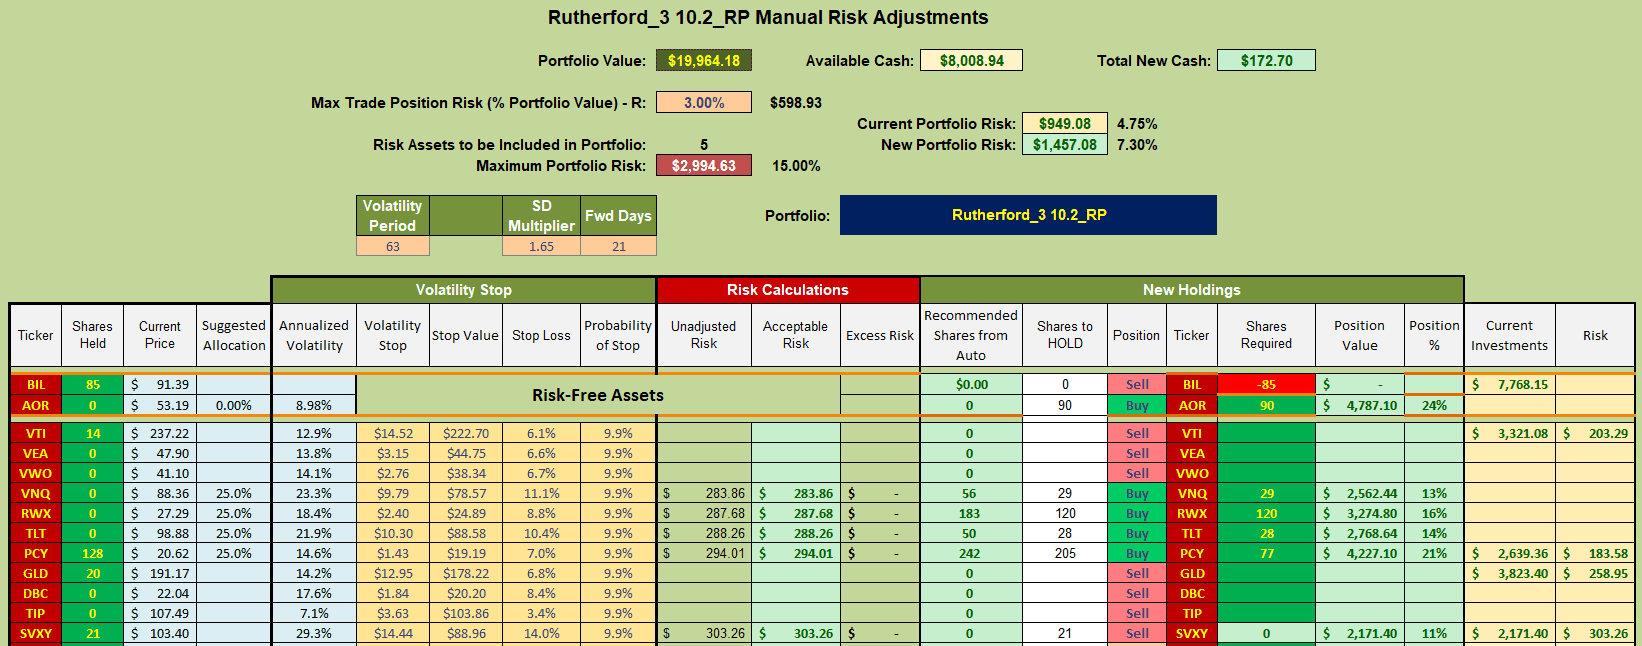 with a rotation out of Cash (BIL) towards the recommended asset classes and the benchmark AOR Fund (since momentum suggests that AOR may perform better than holding excess funds in BIL after caculating the risk parity allocations to the other ETFs).
And so …. into 2024. Wishing all our ITA Wealth Management readers a Happy New Year and successful investing in 2024.
Discover more from ITA Wealth Management
Subscribe to get the latest posts sent to your email.
David,
Is there a reason for using the Heikin-Ashi investing model? As I recall when I was testing the LRPC, BHS, and H-S models, Heikin came in last based on performance.
Lowell
Lowell,
The HA model generates a signal that reacts relatively quickly to changes in market conditions – therefore the advange is that we should not see large losses on any single trade/position. It therefore works best for assets with low volatility where short-term “trends” may continue into longer-term trends. The downside of the HA signals is that they may generate “whipsaw” trades for more volatile assets. Just because losses on individual trades may be low does not mean that we should expect to see small draw-downs since consecutive small losses may result in significant draw-downs.
I still like the HA signals because of their ability to identify trend changes quickly – but, over long time frames, a diversified portfolio probably sees too many “whipsaws” to make the HA system, on it’s own, an attractive system. Building the signals into a more complex system like the BHS system (that incluse HA signals in the “Score”) is generally a better way to use these signals. Of course, that is assuming that momentum systems are working better than mean reversion systems 🙂
David
David,
2022 and 2023 were good examples of bad and good years. Going back even further, I tested momentum models and was not satisfied. I now am concentrating on three different investing models or approaches.
1. Nothing but U.S. Equities with no trading. Copernicus. This is also the most tax efficient.
2. Robo Advisor or computer managed portfolio, sometimes called Intelligent Portfolio(s). Schrodinger. Also tax efficient.
3. Sector BPI Investing Model. All the other ITA portfolios. Early data is very promising. The model is very close to a mechanical model so investors do not need to rely on any special expertise.
Lowell