
Painted Hills in B&W.
Before beginning this update of the Bethe I checked the Bullish Percent Indicator (BPI) data for the eleven sectors and none are oversold. Sector ETFs that were overbought have long had Trailing Stop Loss Orders (TSLOs) in place in an effort to protect capital as well as to follow the investing rules for the Sector BPI model. Since there are no oversold sectors we look to the three U.S. Equity ETFs (VTI, VOO, and ESGV) for buying opportunities.
In the middle footer below readers can find the portfolios that are coming up for review over the next week.
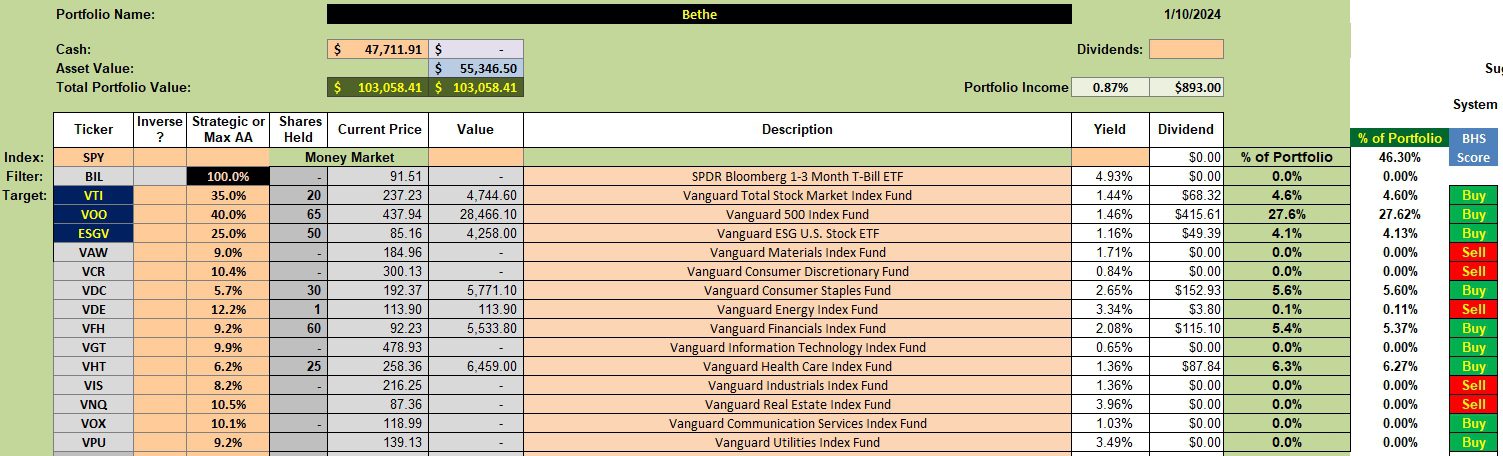
Bethe Security Holdings
The sector exposure is getting a little thin as several sectors hit their 3% TSLO price during the market decline early this month. Some of that cash has been reinvested in VTI, VOO, and ESGV. A later screenshot will let us know if these were productive moves.
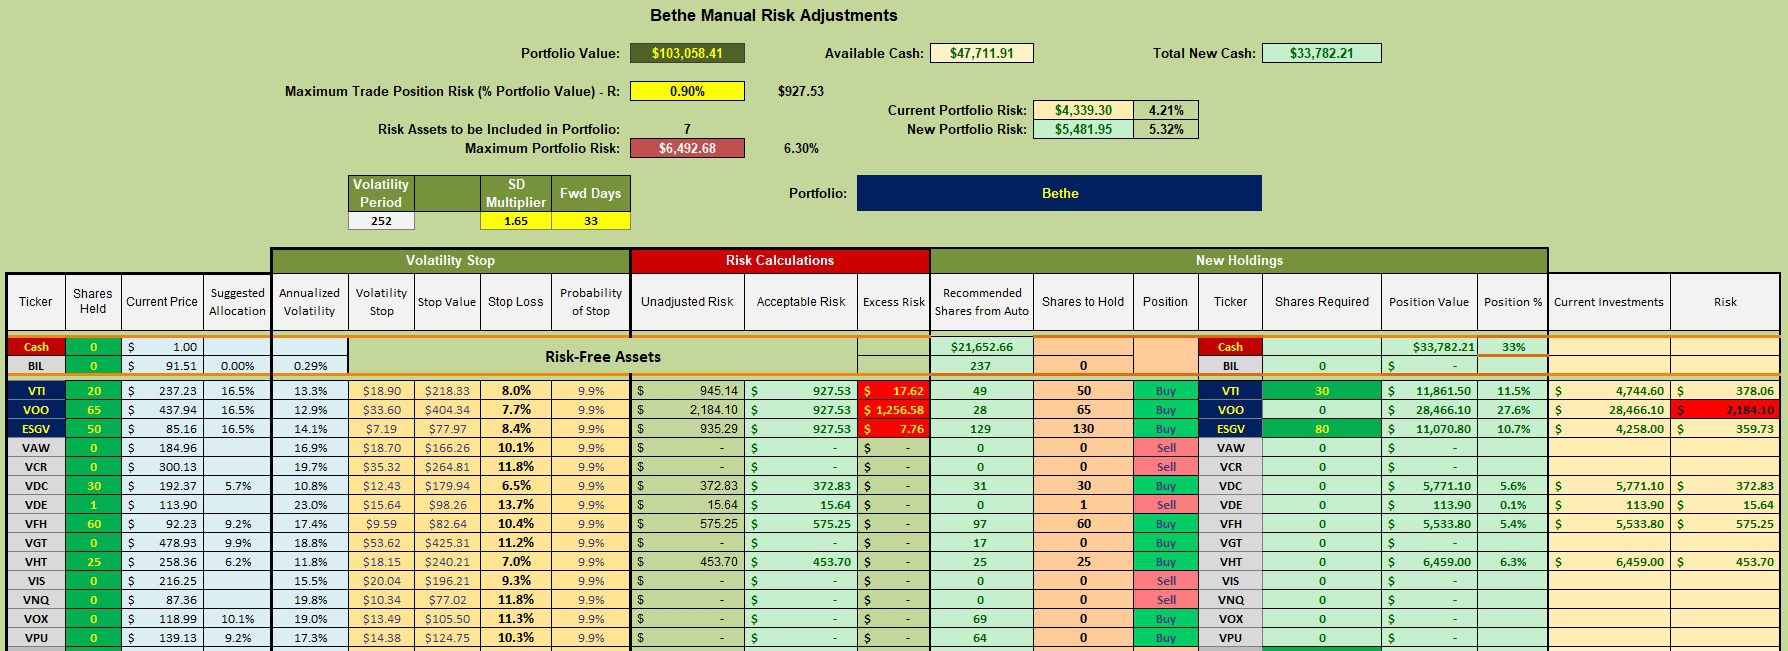
Bethe Manual Risk Adjustments
In the worksheet prior to the one shown below, users of the Kipling spreadsheet have the option of controlling portfolio risk.
- The SD Multiplier is set to 1.65 so the Stop Loss percentage for VTI comes in at 8.0%. This is the first risk control factor I manipulate.
- The Maximum Trade Position Risk is set to 0.50 as a risk control for the Maximum Portfolio Risk (6.30%). By adjusting this variable to 0.50 Shares to Hold are altered. VOO is oversubscribed so no more shares are required. Limit orders are in place to add more shares of VTI and ESGV.
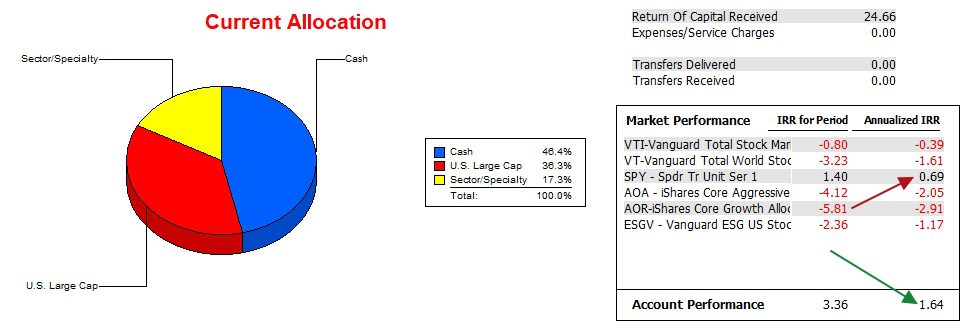
Bethe Performance Data
Now we come to performance over the past two years. The annualized Internal Rate of Return (IRR) for the Bethe is higher than the 0.69% for the SPY benchmark. All other potential benchmarks are in negative territory.
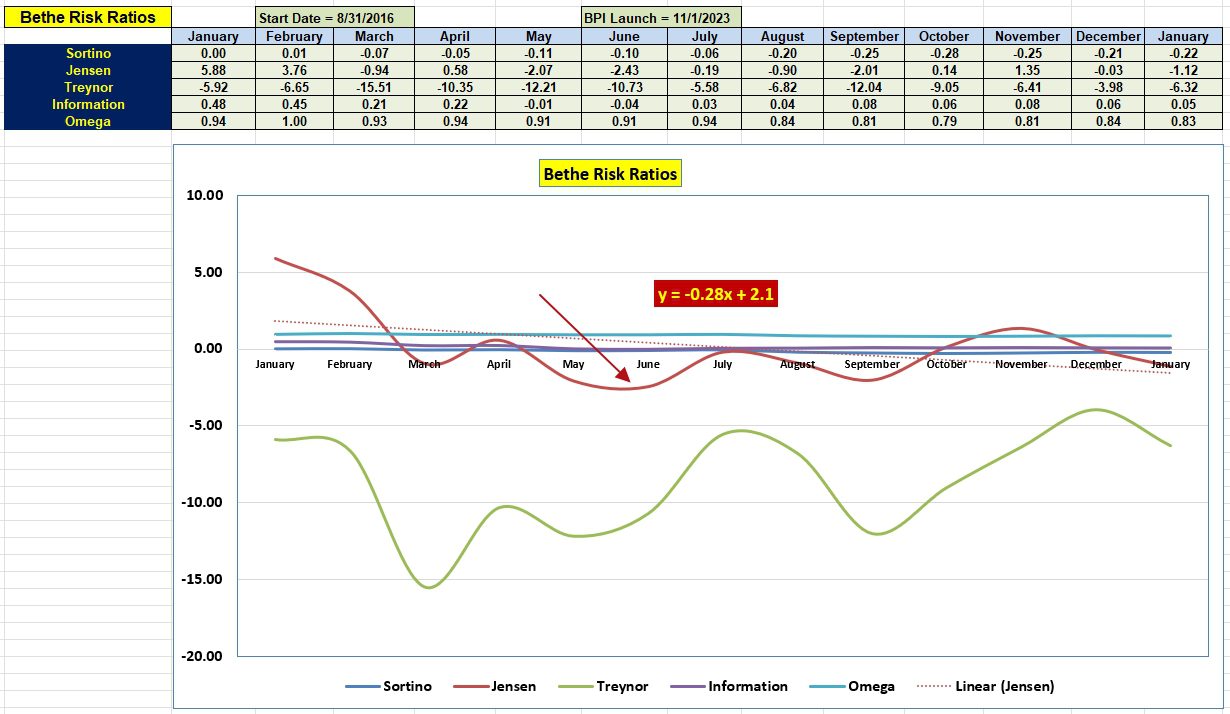
Bethe Risk Ratios
Investors new to the ITA blog should pay most attention to the Jensen, Information, and Sortino Ratios in that order. The current Jensen is a tad disappointing as we are back to where we were this past summer. The Information Ratio stabilized over the past several months.
The slope of the Jensen (-0.28) is not going to improve until we clear the January and February data from 2023.
The Treynor and Omega Ratios are less important. Omega is a duplication of the Sortino and the Treynor is too dependent on the beta of the portfolio.
Bethe Sector Portfolio Report
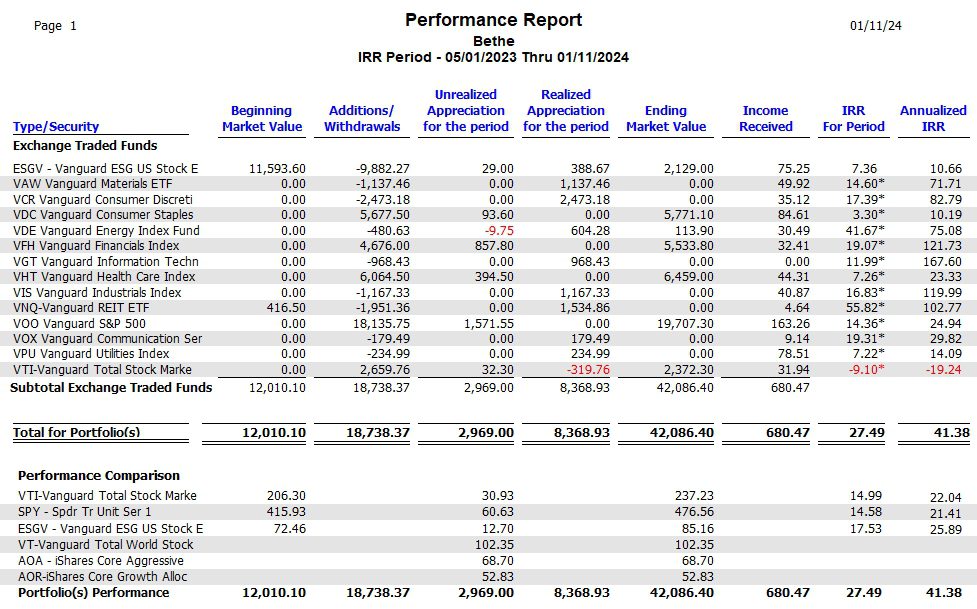
The following table of data is published infrequently. I only switched the Bethe to the Sector BPI investing model last spring and that is the reason for the 05/01/2023 starting date. At that time the Bethe already held shares in ESGV and VNQ, but none of the other sector ETFs.
The Bethe Performance Report includes all transactions for the past 8.4 months. During this period the annualized IRR is 41.4% while the SPY benchmark is 21.4%.
A few points of interest are worth noting. Within the portfolio the annualized IRR for ESGV is 10.7% while if held during the entire period it is 25.9%. A Buy and Hold strategy is much better for ESGV than attempting to fill in the gap for when sector ETFs are out of favor.
The same holds true for VTI. Keep in mind that VOO and SPY track together. VOO held in the Bethe edged out the Buy and Hold 24.9% to 21.4% for SPY.
The large advantage of Bethe over the benchmark during this eight month period is attributed to the Sector BPI investing model. As more data comes in month after month, it is this Performance Report that will inform us as to the viability of the Sector BPI investing model.
Tweaking Sector BPI Plus Model: 20 May 2023
Tweaking Sector BPI Plus Investing Model: Part II
Millikan Sector BPI Update: 20 July 2023
Discover more from ITA Wealth Management
Subscribe to get the latest posts sent to your email.
You must be logged in to post a comment.