Juvenile seagull and the Adamaski Effect.
This week the general trend for U.S. Equities was down, although there were a few exceptions. Five of the seven indexes are bearish while nine of the eleven sectors come in with the same bearish message. No sectors are sufficiently bearish to call for any Buy signals.
Five portfolios are scheduled for an update this week so it will be a busy time here at ITA. This week we will pass the January halfway point so the risk ratio data will begin to carry more weight.
Index BPI
The right side of the Index BPI table provides a quick and visual picture of what is happening with seven major indexes. Pay most attention to the NYSE and NASDAQ as they are the largest and therefore most comprehensive indexes. The S&P 500 is our benchmark and it is still overbought.
For more precise data, use the bullish percentages found on the left side of the table. There are times when the percentage and X’s or O’s move in opposite direction. This due to changes within the week. I only post end-of-week data.

Sector BPI
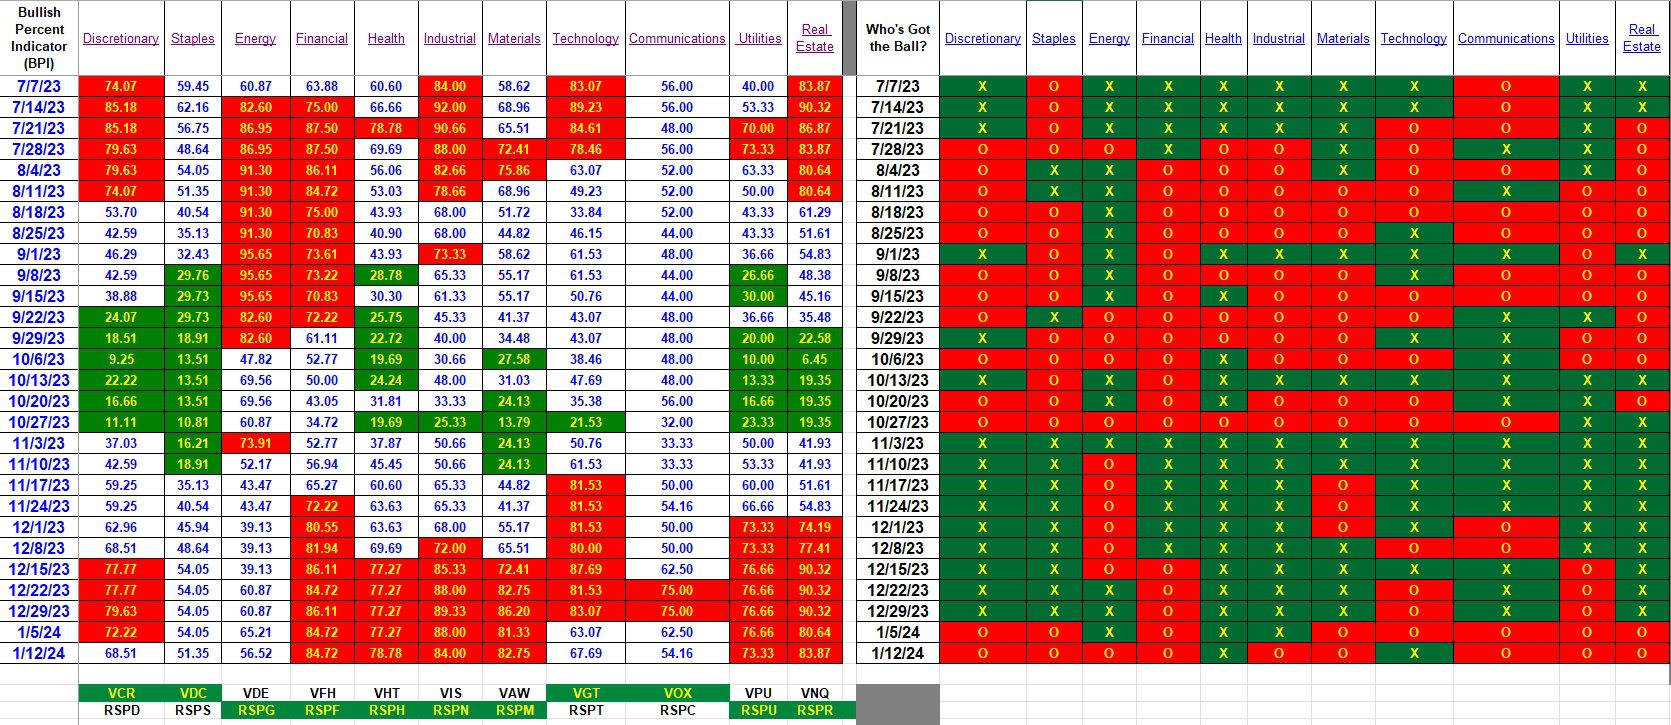
The following table is the one we use to manage the sector ETFs that populate the Sector BPI portfolios. Since no sectors are oversold we do not have any Buy recommendations come Monday. All sectors hold stocks that are more bullish than bearish so it is unlikely we will see any buying opportunities this week.
If there is a major market move that is likely to impact the sector BPI data I will check on it mid-week. If I spot a buying opportunity I will post the information either in the Forum or in the Comment section of the most recent BPI data blog.

Comments and Questions are always welcome. Pass on the https://itawealth.com link to your friends.
Discover more from ITA Wealth Management
Subscribe to get the latest posts sent to your email.
You must be logged in to post a comment.