Main Street – Bodie, CA
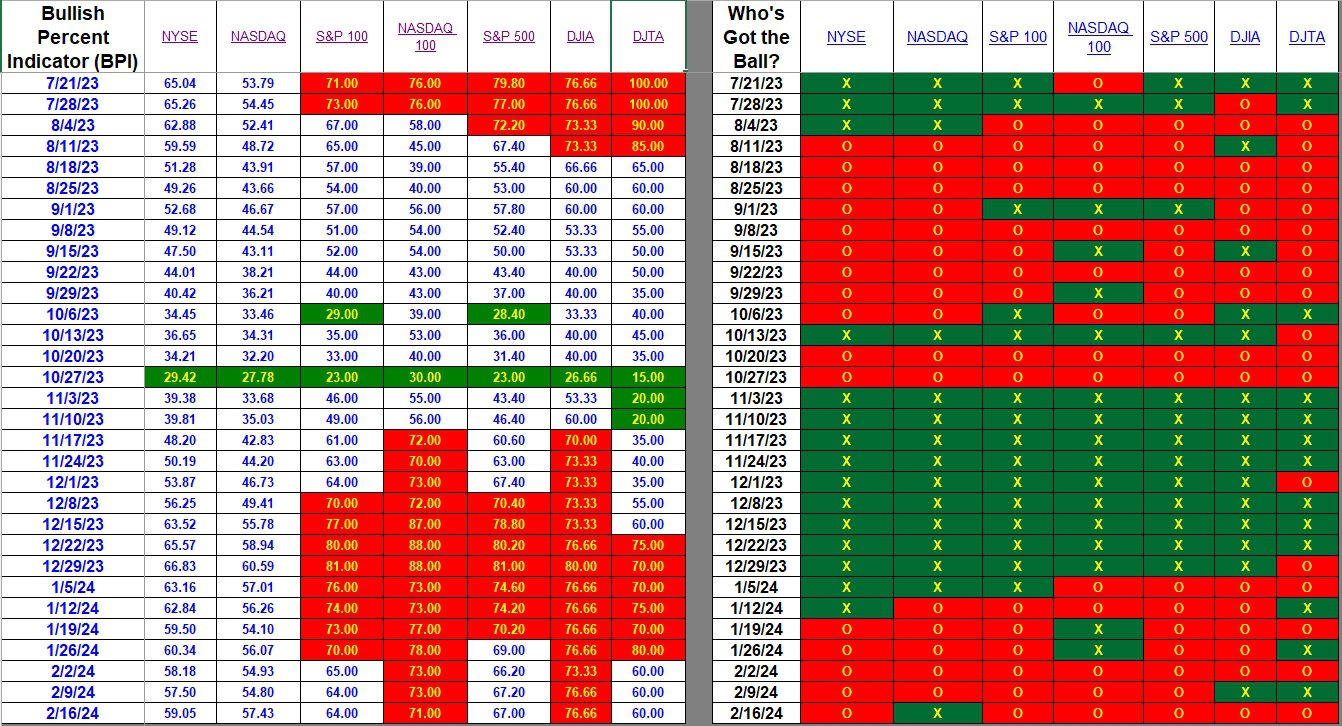
Bullish Percent Indicators are a different way of examining the behavior of the securities market. Keep in mind that the two tables shown below concentrate on U.S. Equities. The top table looks at seven broad indexes and there are plenty of overlapping stocks between the indexes. I pay most attention to the NYSE and NASDAQ as they incorporate all the stocks found in the other five indexes. When you hear a news announcement that the market is up or down, they are generally referring to the Dow Jones Industrial Average which is only 30 stocks. Right now that index is overbought while the broader market such as the NYSE is approximately 60% bullish.
To learn more about BPI graphing, look up Point and Figure (PnF) charting.
Index BPI
This week finds only the NASDAQ bullish. Both the NYSE and NASDAQ improved slightly indicating a few mid- and small-cap stocks moved into bullish territory. The more concentrated indexes or those that focus on large-cap stocks remained even or dropped slightly. BPI data shows a rather flat U.S. Equities market for the week.

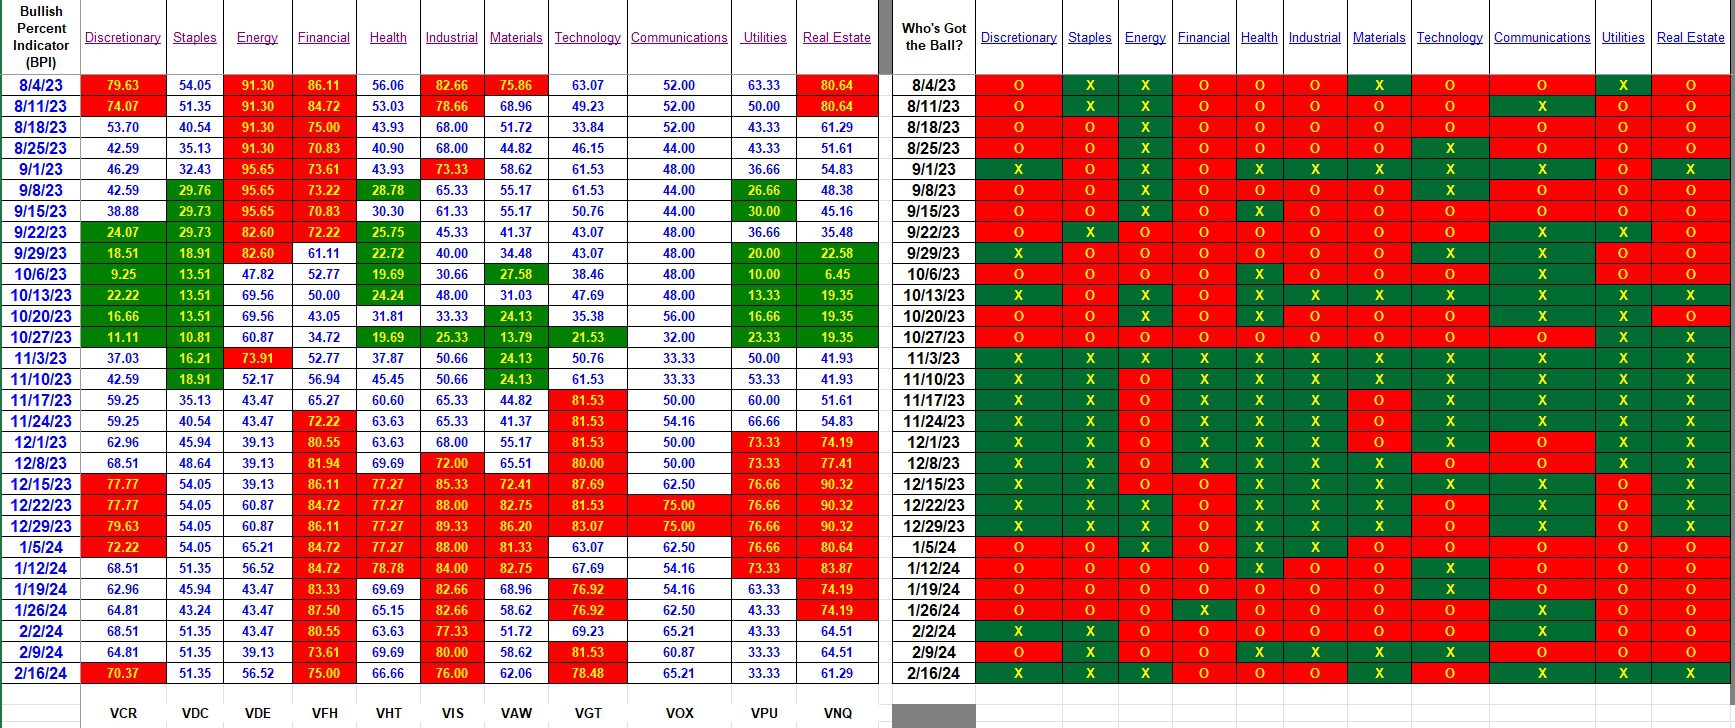
Sector BPI
When the U.S. Equities market is split into eleven (11) different sectors, what information can we extract as we use this information to manage Sector BPI portfolios? First, Utilities moved out of the oversold zone. I assume investors were able to purchase shares of VPU this week when Utilities dropped into the oversold zone for a few days. I posted information in the Forum and in the Comment section of BPI data. That information may have been limited to Platinum and Lifetime members.
Discretionary moved back into the overbought zone this week. I don’t think any of the portfolios I track hold VCR. The move of VCR to oversold back in October of 2023 to overbought in December of 2023 and now back to overbought here in February is exactly the reason as to why VTI, VOO, and ESGV are part of the investment quiver. If these three securities were not available for investing we might be sitting on cash while the market marched upward.
Check your Sector BPI portfolios to make sure TSLOs are set for all the overbought sectors. They are: Discretionary, Financial, Industrial, and Technology. I think ITA Sector BPI portfolios are all out of these four overbought sectors.
When I last checked, ESGV was the highest ranked U.S. Equity ETF. This information will be updated when several ITA portfolios are reviewed this coming week.

Post your questions and comments in the space provided below. Pass the ITA URL or site address on to your friends and family. Post on your social media sites if you think this information is useful.
Discover more from ITA Wealth Management
Subscribe to get the latest posts sent to your email.
Lowell,
I took positions in VPU in 3 portfolios. When a $BPI gets close to 30 or 70 I check it daily on the StockCharts webpage. I was surprised to see in the table e 33.33 two weeks in a row without the green buy stripe.
Bob W.
The drop into the oversold zone occurred mid-week so if one waited for end-of-week news one missed it. I think I picked up VPN shares in all the Sector BPI portfolios. I doubt I managed to fill each portfolio to the 9.5% level as I used limit orders.
I posted Buy recommendations mid-week in both the Forum and in the Comment section of a BPI blog.
Good to know you were able to secure positions in three portfolios.
Lowell
Am I correct in assuming ITA readers do not receive notifications of Comments? If this is the case then one must login to see or read comments.
Lowell
Lowell,
That’s true for me, I only get a notice for the original post.
Bob W.
Bob W.,
I installed a new application that is to send notifications when a comment is added. It is not unusual for these apps to fail to meet expectations. Or it could be that I missed a critical setting.
Lowell