“Bullish percent indicators are technical analysis tools used to determine the percentage of stocks in a particular market index that are currently trading above their respective point of recognition (POR), or “bullish reversal point.” These indicators are typically used to identify market trends and to help traders make buy and sell decisions. There are several different bullish percent indicators that are commonly used, including the Bullish Percent Index (BPI), the Bullish Percent Index (BPI) for S&P 500, and the Bullish Percent Index (BPI) for Nasdaq 100.”
The above paragraph was generated using ChatBPT, an artificial intelligent writing tool.
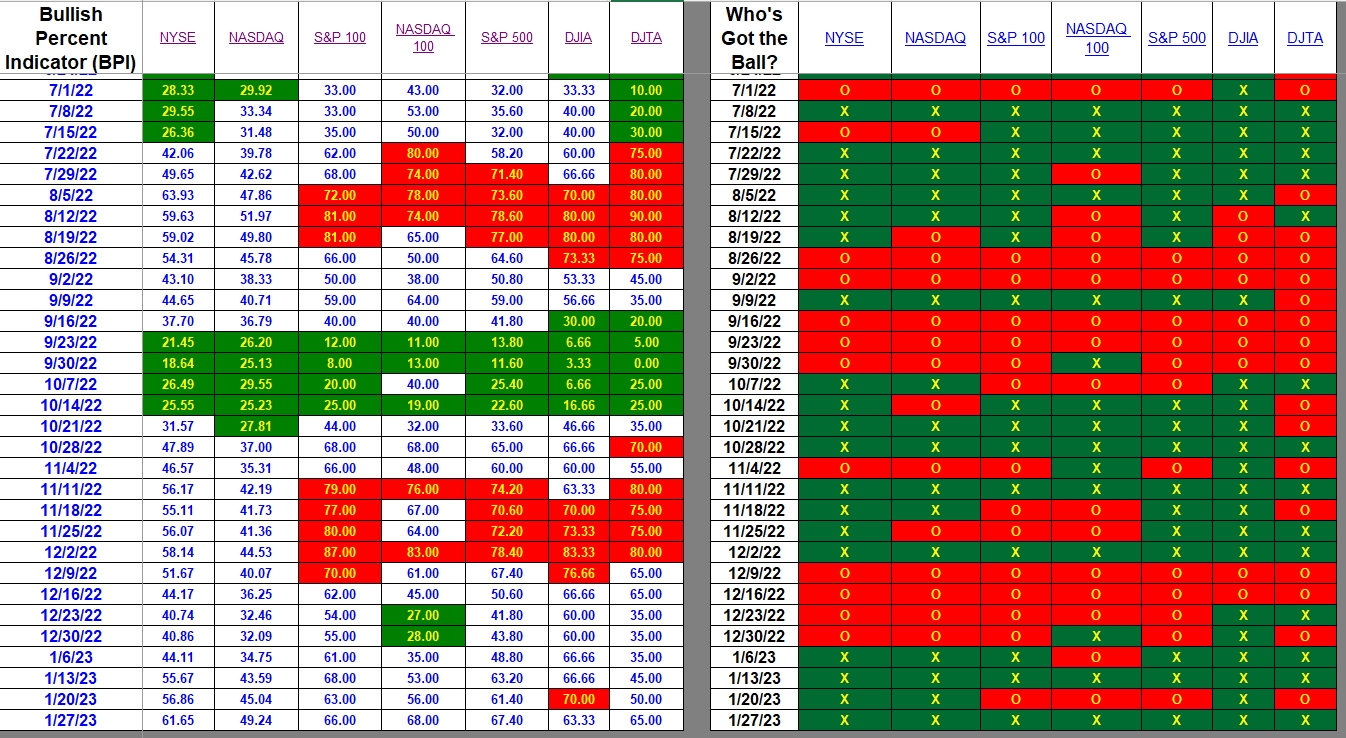
Index BPI
All the index BPI metrics are bullish. The DJIA moved out of the over-bought zone, but still maintained its bullish identification. As you will see in a moment, there was more movement among the sectors of the U.S. Equities market.

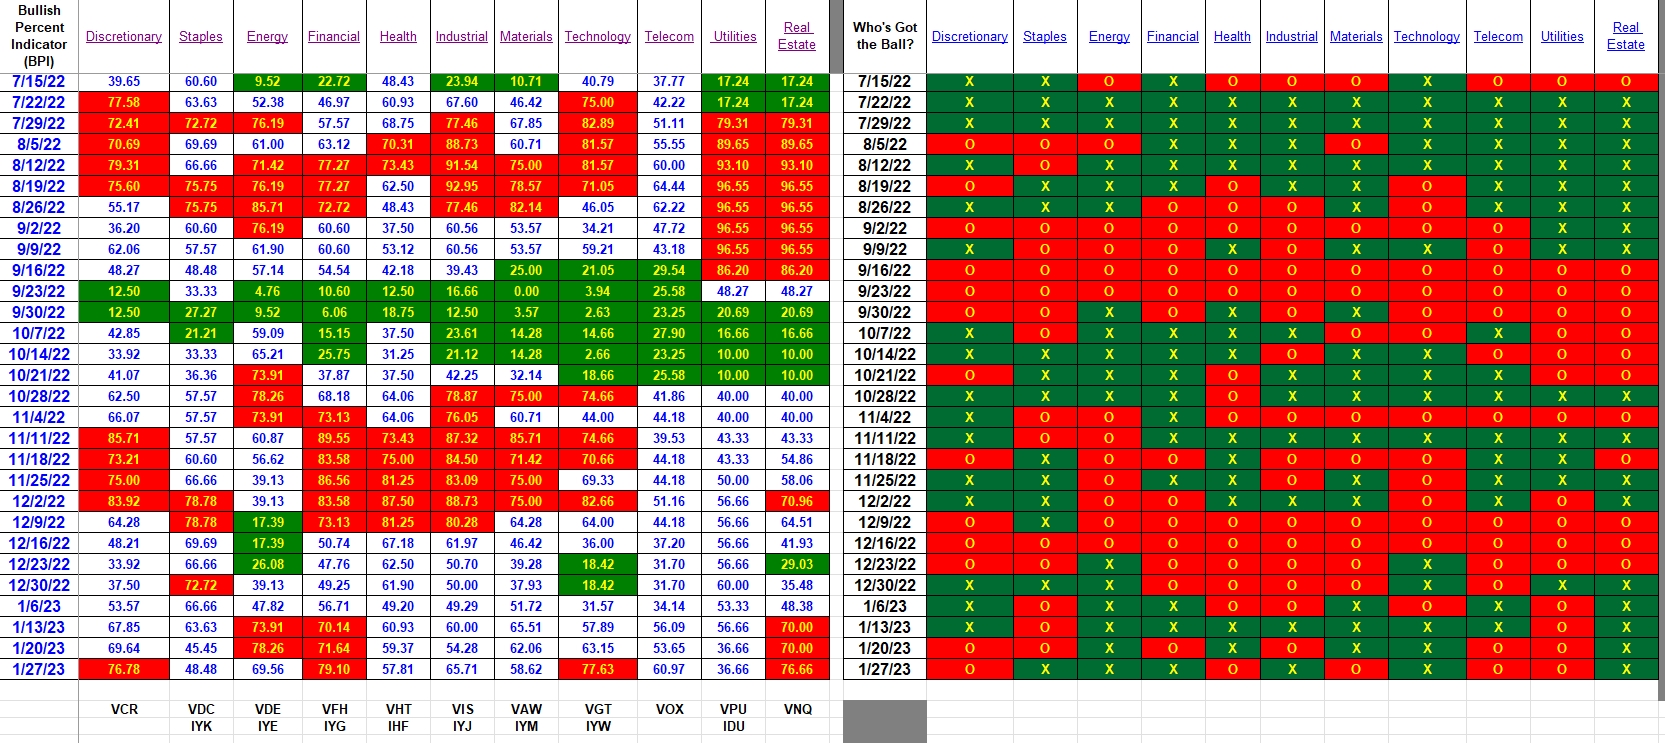
Sector BPI
Four sectors are over-bought. If you hold ETFs for any of these sectors, here is my recommendation for setting TSLOs, provided your broker permits setting values to the nearest tenth of a percent. TD Ameritrade does not permit this, but Schwab does.
- VCR rounded is 77% bullish so set the TSLO to 2.8%. After this setting, don’t tamper with it.
- VFH rounded is 79% so set the TSLO to 2.1%. This assumes you did not set the TSLO earlier. If you set it back in week 1/13/2023, they it would have been set at 2.9%.
- VGT rounded is 77.6% bullish so set the TSLO at 2.4%.
- VNQ is also over-bought and is currently 76.7% bullish so the TSLO is set to 2.3%. If you held VNQ back on 1/13/23 then you would have set the TSLO at 3.0%.

Dollar Cost Averaging
Dollar cost averaging is an investment strategy where an investor divides a larger sum of money into smaller, fixed investments made at regular intervals over time, regardless of the share price. This can help to reduce the impact of volatility on the overall purchase. For example, an investor might invest $500 into a stock every month, rather than investing the full $6,000 all at once. This can help to mitigate the risk of investing a large sum of money at the wrong time.
Dollar cost averaging is the method used to populate the Copernicus portfolio.
Explaining the Hypothesis of the Sector BPI Model
Discover more from ITA Wealth Management
Subscribe to get the latest posts sent to your email.
You must be logged in to post a comment.