
Budapest, Hungary
One of the biggest challenges in Portfolio Construction results from the desire to generate positive returns (within acceptable volatility limits) under any/all market conditions. Our overall objectives are to generate maximum returns with minimum risk. But returns and risk are inexorably linked – with returns tending to be reduced as we reduce risk. We are (ideally) paid to take risk.
Returns are measurable – but are not predictable – whereas risk is not measurable directly (because there is no universally agreed definition of “risk”) but is often measured by proxy based on variance or standard deviation of price movement and annualized as volatility. Thus, risk, as measured this way, is more predictable in that it tends to have limits – it cannot go to zero, upside is somewhat constrained, and there is a tendency to revert to a mean. So, let’s take a closer look at volatility.
When we talk about volatility, we are usually referring to the Historical Volatility of past price actions and, while it might not be unreasonable to anticipate that this behavior should continue in the future, this is not always the case – particularly in the short-term – and the predictive value of historical volatility becomes questionable in this time frame.
However, there is another measure of volatility, that is derived from prices in the Options derivative markets. Because of the way Options are priced (depending on strike price, time to expiry, interest rates and volatility) the only parameter that is not firmly known is volatility – so “Implied Volatility” can be “backed-out” of quoted Options prices and reflects the sentiment/expectations of investors/traders of future volatility (or “risk”).
Specifically, Implied (future) Volatility in the S&P 500 equity markets is measured by the VIX Volatility Index. The VIX is often referred to as the “fear” index because of it’s tendency to spike at times of distress in the SPX (S&P 500 Index):
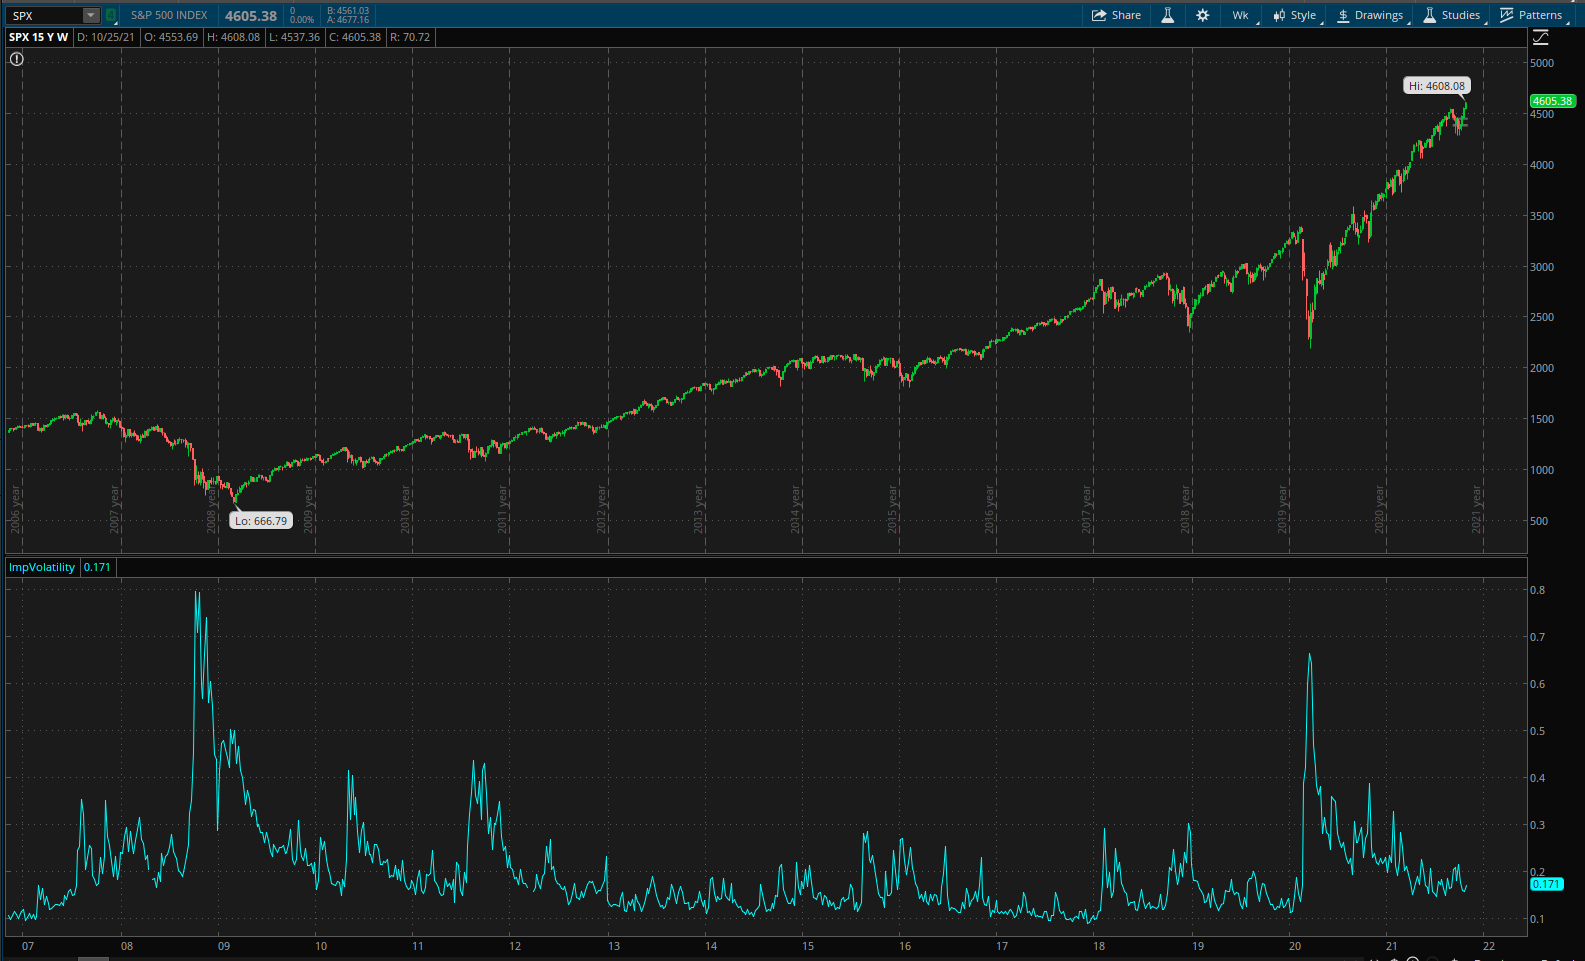 In the lower pane of the above figure, we can see the spikes in Implied Volatility (IV) during periods of market weakness (e.g. financial crisis of 2008, Covid-19 pandemic in 2020 and four or five more minor instances in between). There are also very few times when IV has dropped below ~10% and IV tends to revert to a mean of ~14-19%.
The VIX Index is calculated from Option prices to reflect the anticipated volatility of the S&P 500 stocks over the next 30 days.
Ok, so we have a measure of (future) volatility in the VIX Index – but we cannot trade the VIX (directly) ☹. So, what can we do?
This is where things start to get complicated since we have to take a look at the Futures markets. Futures (like Options) are a derivative product that represent contracts for the purchase or sale of the “product” at a defined date in the future. VIX Futures are tradeable on the CBOE Futures Exchange (CFE).
To get a feel for VIX futures we can take a look at a picture from vixcentral.com:
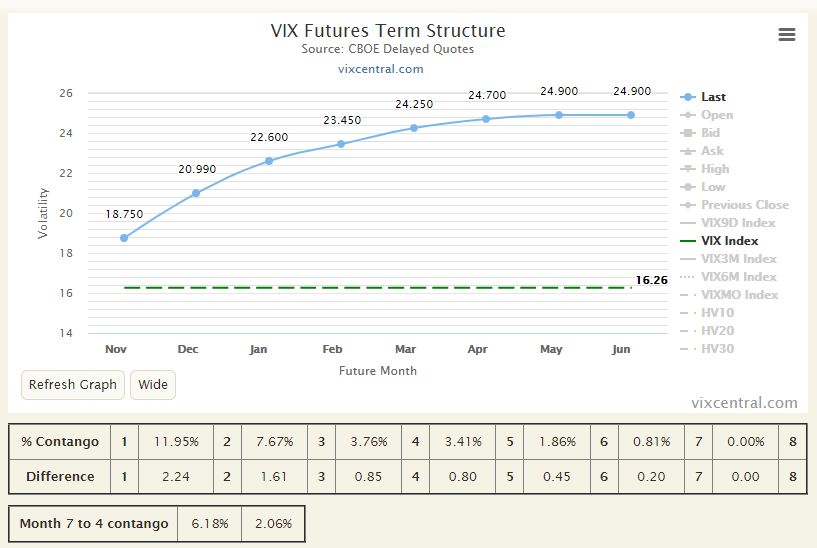
The above figure shows what is called the “Term Structure” of the Futures contracts. It is simply the price at which Futures contracts are trading and a comparison with the “spot” price of the product – in the above example this is 16.26 for the VIX Index.
In the above example, VIX Futures expiring in December can be bought or sold at 20.99 (the expected future value of VIX) – or at a ~29% premium. Futures expiring in January are trading at 22.60 (39% Premium). When Futures prices are increasing as the expiration date moves further out in time, prices are referred to as moving in “Contango”. When the opposite is true, prices are referred to as being in “Backwardation”.
If we could trade “spot” VIX we could Buy VIX at 16.26 and Sell VIX Futures expiring in November at 18.75 as an arbitrage trade with a guaranteed 15% return. Unfortunately, as stated above, “spot” VIX is not tradeable.
Now, this is where things start to get complicated. You may be wondering why I’ve had to introduce Futures at all – especially since I’m assuming that we don’t want to trade Futures contracts. The reason is that in order to find a tradeable product, that is related to the VIX, we need to move to an ETP (Exchange Traded Product). In this space we find VIXY, the ProShares VIX Short-Term Volatility ETF. This ETF is related to the VIX but it is priced from the VIX Futures Contracts (that are different from the “spot” price) as described above. We also find SVXY, the ProShares Short VIX Short-Term Volatility ETF – or the inverse of VIXY and a product that can be bought to (effectively) short volatility.
Ok, so now we have 2 products that we can Buy to long (VIXY) or short (SVXY) volatility.
Let’s take a look at these ETFs. First, the long volatility VIXY:
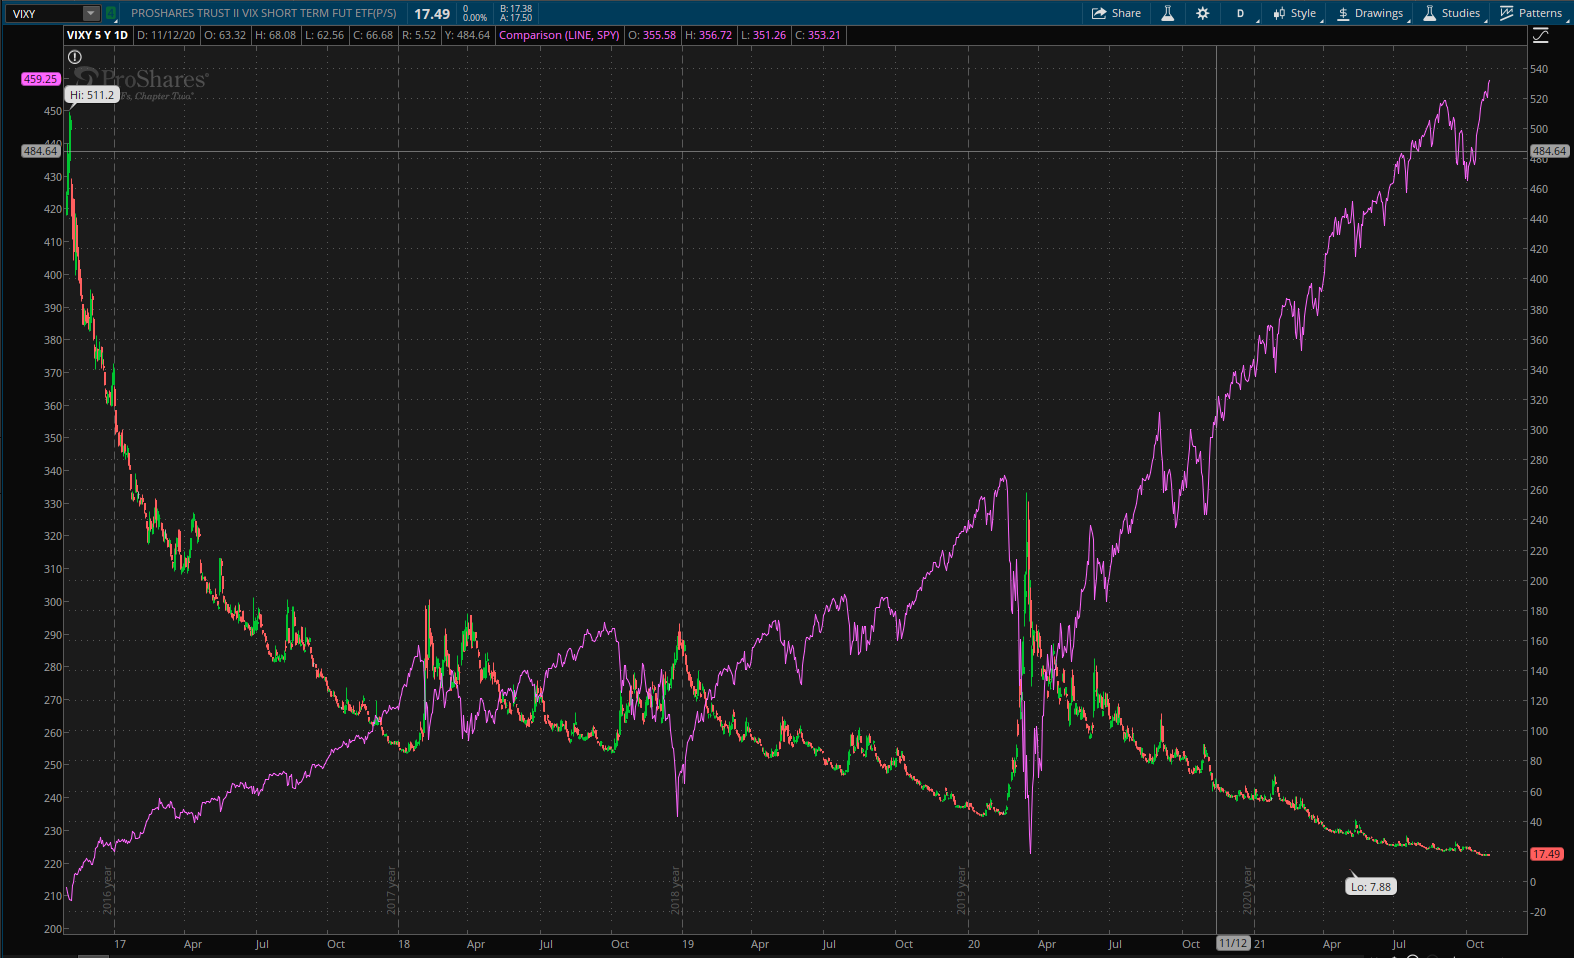 where we can immediately see that this is not a product that we want to be holding for a long period of time. This is a consequence of prices being derived from futures pricing (drag) – not because volatility is constantly decreasing over time.
Now let’s look at the short volatility SVXY ETF:
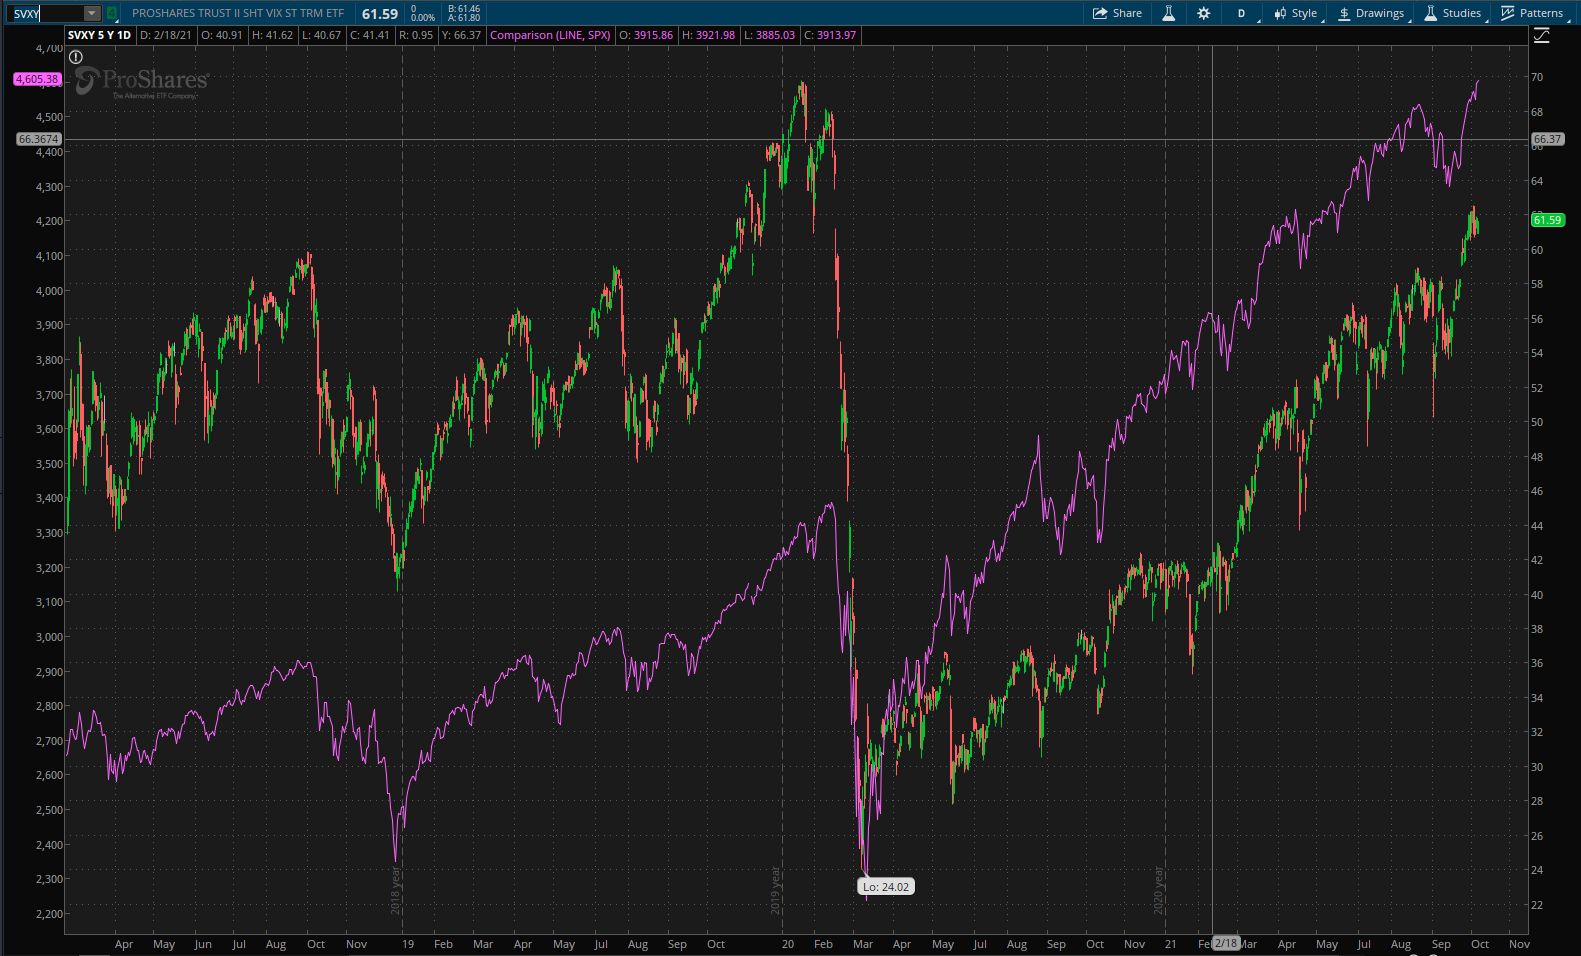 where we see movement with a high correlation to the underlying SPX Index (purple line). However, note the ~65% decline in the value of SVXY with a more modest ~30% decline in the SPX over a short monthly period at the start of the Covid-19 pandemic. We need to avoid this strength of loss – so monthly reviews are not likely to be useful when trading these products.
Now, all we need is to establish rules as to whether we want to be long or short volatility. Unfortunately, this doesn’t get any easier to understand from here.
Although we can’t trade the VIX we can download values for the VIX index. Remember that this is an expectation of volatility of the SPX Index 30 days in the future. This, in turn, is related to VIX Futures prices 30 days in the future (and is calculated from weightings of prices around the 30-day time period).
Less well known is the fact that we can also download prices for VIX3M – or the expected volatility of the SPX Index 3 Months (90 days) in the future.
Thus, these are like looking at the prices of 30-day and 90-day futures if these were continuous contracts (rather than monthly expirations). The adjustments come through the relative weightings of the monthly contracts.
Ok, for readers that are still with me, what do we do with this information?
From the performance of VIXY and SVXY shown above it looks like it might be preferable to be short volatility (long SVXY) most of the time – so let’s take a look at the VIX/VIX3M ratio (Implied Volatility Term Structure – IVTS) and choose to go short volatility when the ratio is less than 1. This occurs when 30-day IV is less than 90-day IV – or when prices are in “Contango”.
If we were to Buy SVXY when IVTS was less than 1 and switch to VIXY when ITVS was greater than 1, then out profit/loss performance might look like this:
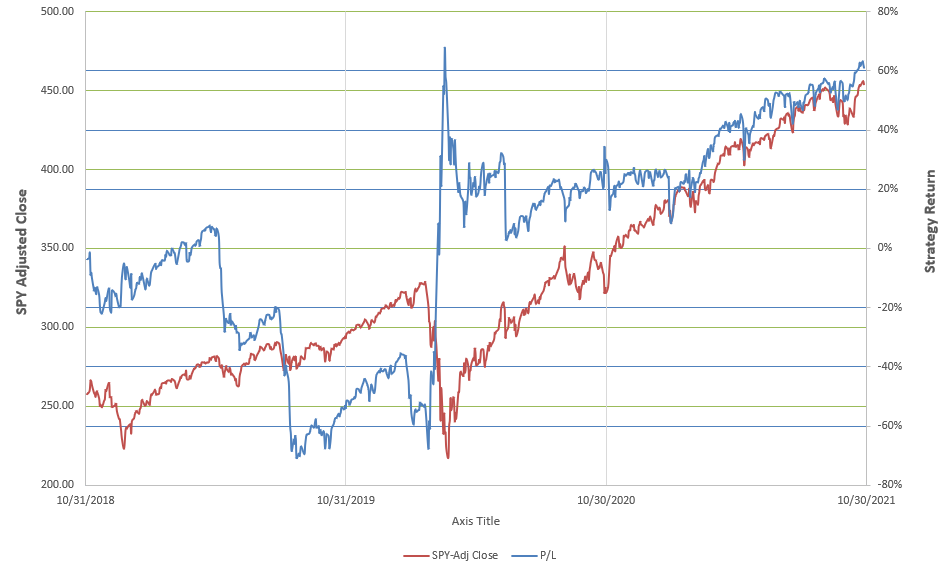
The above graph shows return performance relative to the price of SPY (SPX tracking ETF). This isn’t a bad start in that it reflects a 60% return over 3 years. However, we also have a 60% draw-down in the first year. The big attraction is the jump from a 60% loss to a 60% gain over the month of the pandemic crash in 2020. While this might achieve some of our objectives it is a bit of a scary ride – so we wouldn’t want to allocate funds heavily in this strategy. Overall volatility is extremely high.
In considering possible rules for choosing between wanting to be long or short volatility we need to look at probabilities. As we saw in the first screenshot above, IV seldom drops below 10% – therefore there will be few people willing to sell volatility at this level unless the risk premium is extremely high. Probabilities suggest that we want to be long volatility when IV is low. Conversely, when volatility is high (say greater than ~40%) we probably want to be short volatility since IV doesn’t tend to stay that high for too long before dropping. In between, the choice is less clear.
An alternative to the simple single cut-off, illustrated above, would be to consider multiple different cut-offs depending on the absolute value of Implied Volatility (say, VIX3M ).
If we look at the return performance shown above relative to the IVTS (VIX/VIX3M ratio) we see the following picture:
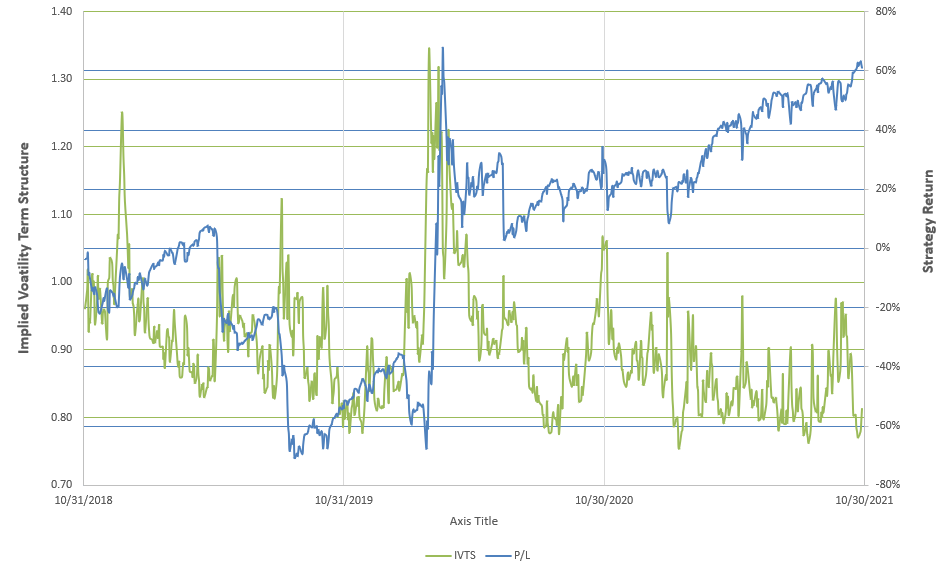
And, if we modify the above single cutoff rule with some rules that take into consideration the absolute value of VIX3M we might expect to see something more like this:
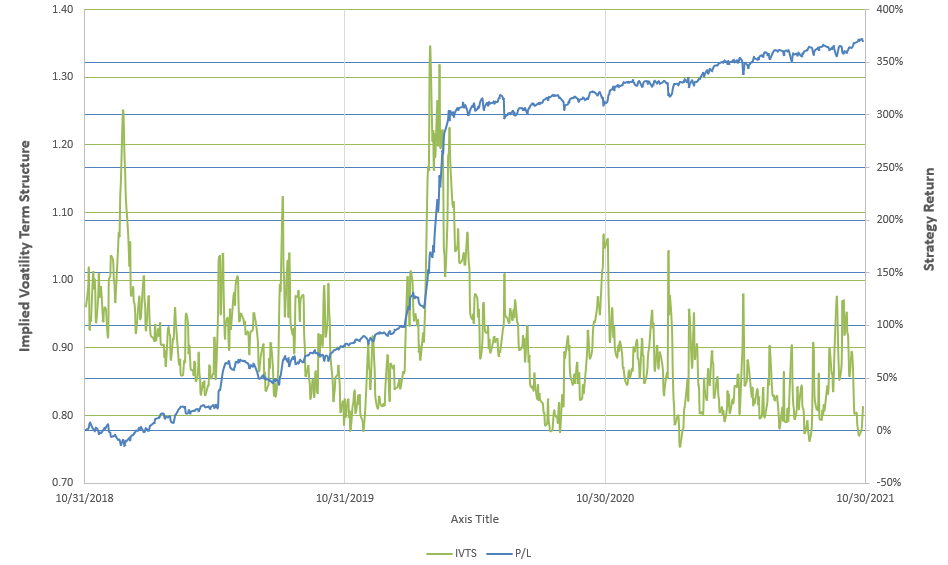
….that looks really nice.
Implementation of the “system” is simple – just a choice between one of two ETFs – however, the concepts and details behind the strategy are quite complex. The level of added diversity to a portfolio is high since there are no decisions to be made regarding multiple asset classes.
I know that ITA members may be disappointed to read that I am not going to reveal more details of the final algorithm – it has taken a lot of thought and work to get to this point and I have to treat this as proprietary material at this time. I will include this strategy in some of the portfolios that I review on this site so that members can follow performance in real time and I may eventually make a workbook available for members to use – but the algorithm details will likely still be hidden.
Since this is a new addition to my arsenal of trading strategies, I am still not comfortable in recommending it as a “must have” strategy and sizing/allocation is still a bit of a guess. You will note that I am only allocating $1,000 to this strategy in a live account at this point in time. This is ~10% of the total value of the portfolio in which I’ve included the strategy (Darwin).
When adopting any new strategy I believe that it is important to start small and to build confidence. With this strategy, despite the performance suggested by the above equity curve, I really don’t expect to generate 350% returns in 3 years – and I am well aware that large drawdowns are possible – so, best to start small and learn how best to manage the strategy.
As we have stated numerous times on this site, no single “system” achieves the objective of generating maximum returns with minimum risk at all times. Thus, we need to combine “systems” to meet our goals.
Your comments and feedback are welcomed.
Update: 27 November 2021
The following screenshot was taken on Friday when the VIX (Implied 30-day future volatility) was trading above the VIX3M (Implied 90-day future volatility). This suggests a potential “backwardation” situation despite the fact that Futures (blue data/line) are still in Contango.
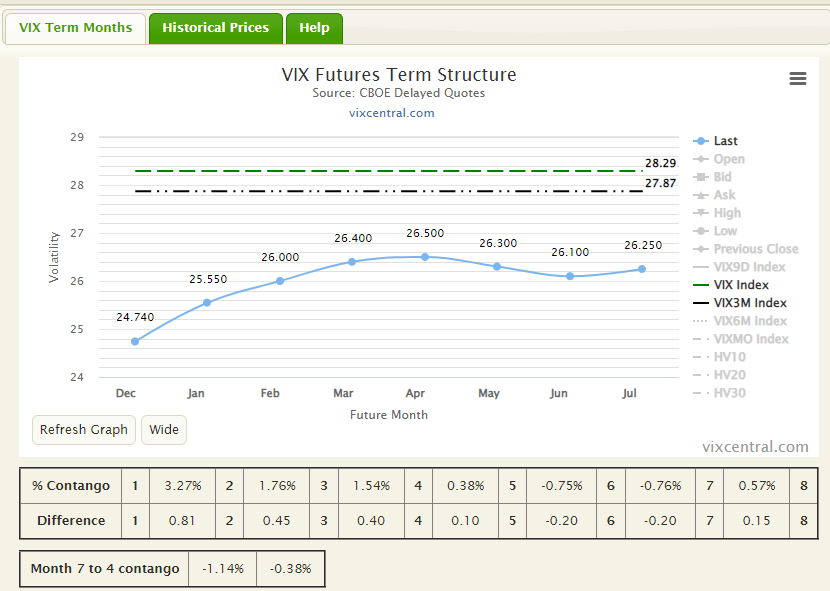
With VIX greater than VIX3M the VIX/VIX3M ratio (IVTS) moves above unity (1.015) and raises a warning flag. As shown in the above post, buying volatility (VIXY) might be an option at this point (although I prefer a slightly higher value at these volatility levels). In addition, this might also be taken as a signal to exit positions in US equities.
David
Discover more from ITA Wealth Management
Subscribe to get the latest posts sent to your email.
With all the action on Friday I am seeing warning signs from Volatility data. Accordingly I have added an update to the above post that can be seen at the bottom of the page.
David