Entrance to Betty Ford Alpine Gardens, Vail, Colorado
In Part 1 of this series of posts (https://itawealth.com/constructing-a-core-investment-portfolio-part-1-buy-and-hold/) I described how a new investor (or an investor wishing to change their current portfolio structure) might set up a simple Buy-And-Hold portfolio of ETFs that requires little or no management. The portfolio consisted of only four ETFs that were equally weighted and could be considered “core” holdings for any investor with a reasonably long-term time horizon and wishing to build a solid investment portfolio with acceptable returns and risk.
However, I concluded the post by noting that, over time (16 years in the example), our initial allocation weights will change and so we should ask ourselves whether this is desirable or whether we should be making adjustments somewhere down the line. If an asset allocation becomes a larger percentage of portfolio value than we initially intended it means that the asset has outperformed other assets in the portfolio (that will be under-weighted) – but there is no guarantee that this will continue in the future and we may see a “reversion to the mean” where it under-performs other assets in the portfolio as we move forward in the future.
One option would be to look at our portfolio on a regular basis and to adjust our holdings so as to bring allocations back to their chosen selected percentages (be that equal weighted or some other Strategic Asset Allocation (SAA) distribution of funds). So, let’s take a look at how this might affect the performance of our “core” portfolio.
Bearing in mind that we may want to keep our management activities (and time spent monitoring our portfolio) to a minimum, we’ll start by looking at annual reviews/adjustments – that shouldn’t stress us out too much. 😊
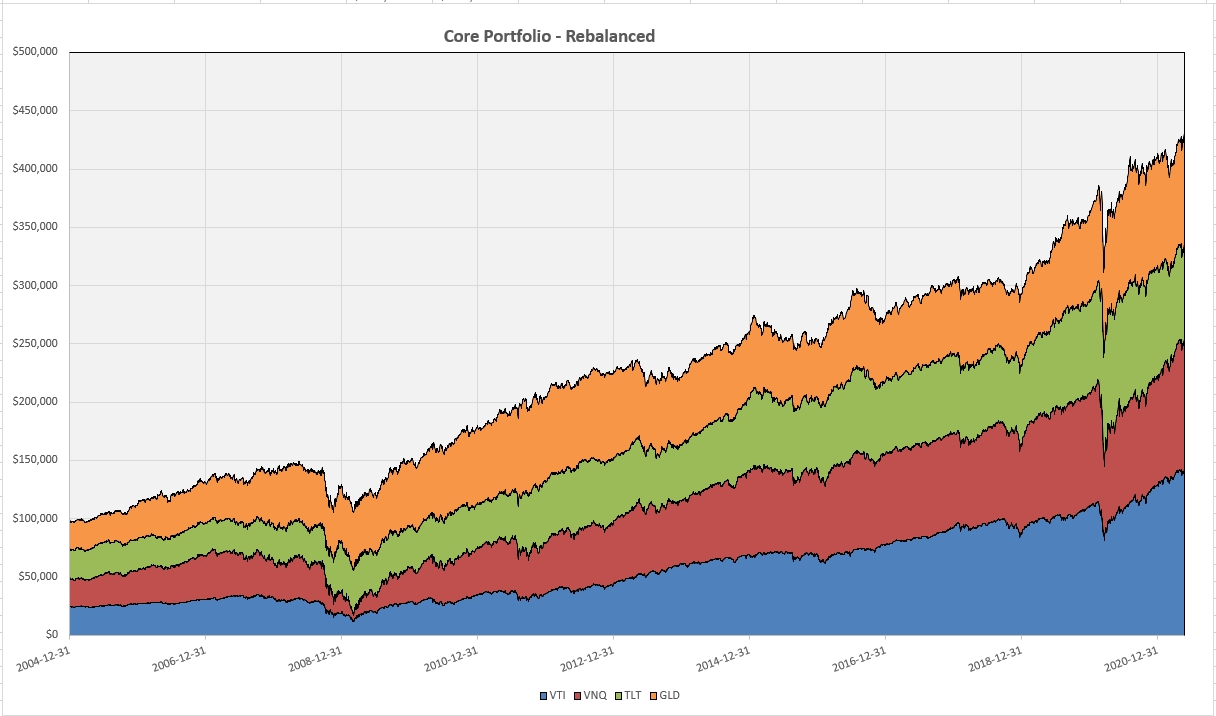
So, every 12 months we will rebalance our “core” 4-asset portfolio so as to bring back our holdings in each ETF to 25% of the total portfolio value at that time. This means selling shares in ETFs that have gone over their 25% initial allocation and buying shares in ETFs that are under-weighted. Graphically, after 16 adjustments (corresponding to the 16+ years we are looking at in this analysis), our equity graph looks like this:

It is difficult to see any obvious difference between this figure and the figure we saw for the strict Buy-And-Hold system. However, if we look closely at the numbers, we find that total return has increased ~13% from $383,857.61 to $432,315.56 and Compounded Annual Growth Rate (CAGR) has increased from 8.54% to 9.33%. Volatility decreases marginally (but not significantly) from 10.78% to 10.22% resulting in an increase in the Sharpe reward/risk ratio from 0.79 to 0.91 – a significant increase in risk-adjusted returns.
Inspired by this improvement, let’s see what happens if we re-balance quarterly rather than annually. I’ll skip the graph because the changes are difficult to see. Moving to the numbers, we find that the total return increases to $444,567.50 at a CAGR of 9.52% with 10.73% volatility that results in a Sharpe Ratio of 0.89.
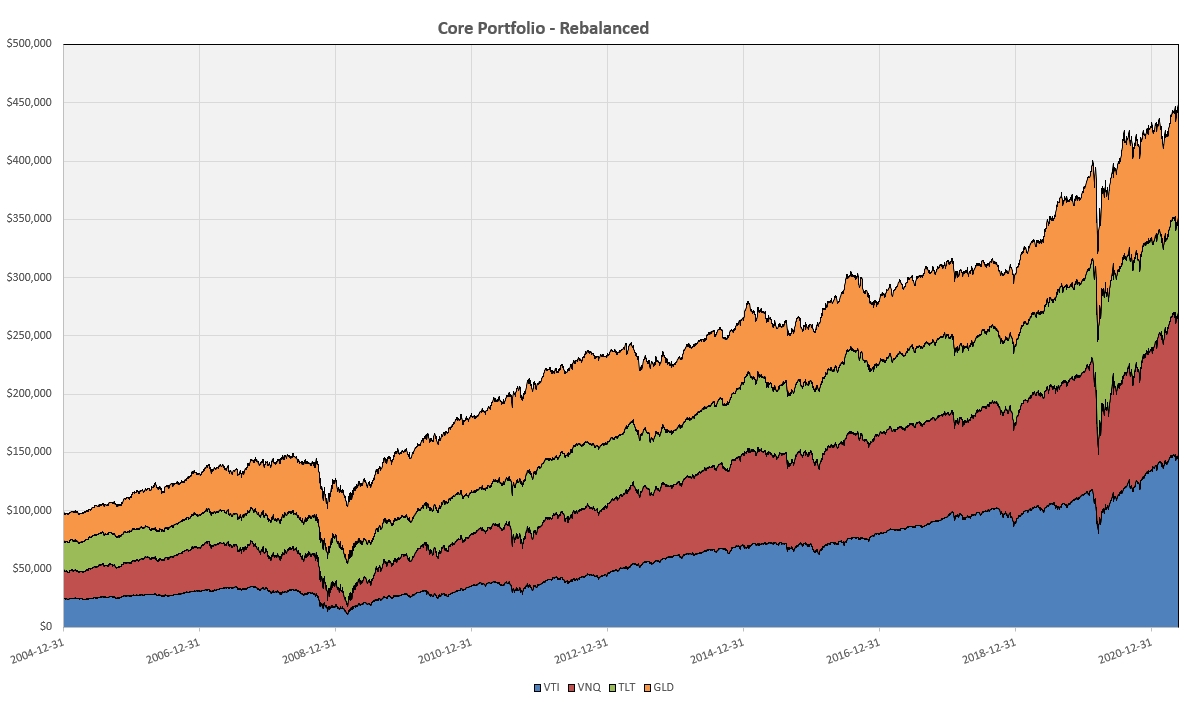
Finally, we’ll try adjusting monthly to see a final portfolio value of $451,014.10 at a CAGR of 9.61% with 10.53% volatility and a Sharpe Ratio of 0.91. The results of all these back-tests are summarized in the figure below:

And the monthly-adjusted equity curve looks like this:

Again, it is difficult to see the subtle differences, but the numbers speak for themselves – periodic rebalancing significantly improves performance, resulting in a 13-18% increase in total returns and an increase in Sharpe Ratio (reward/risk) from 0.79 to ~0.90. However, the frequency of this rebalancing is less important and will depend on the level of attention an investor may choose to give to his/her portfolio.
Finally, an analysis of the impact of rebalancing on maximum draw-down (bottom of the above table) shows that there is little change in draw-down and the Calmar Ratio remains essentially unchanged at ~0.30.
Obviously, there are benefits in rebalancing and the frequency at which this is done may be less important than whether we rebalance at all (and stick to simple Buy-And-Hold). However, we should probably remember that this 16-year analysis period has been especially bullish, despite the two major pullbacks. Personally, I would probably still favor a monthly review – not because I am looking to optimize performance based on historical back-tests (dangerous), but rather because it is likely to result in a more “robust” system as we move forward through unknown market conditions in the future.
[Note: In this analysis I have “mechanically” adjusted allocations at the selected adjustment dates to bring holdings back to their original allocation levels. In practice, we may not actually do this, but set a limit (say 5% or 10%) beyond which we would make an adjustment e.g. 25% moving below 23.75% (-5%) or 22.5% (-10%) or above 26.25% (+5%) or 27.5% (+10%).]
In the next post in this series I will be looking at another option that we might consider to manage our risk that involves volatility targeting and a sophisticated risk-parity approach to risk control – obviously adding another level of management effort.
Again, any member wishing to save a copy of this post can download a PDF file at https://www.dropbox.com/s/j50d8ce19nib19p/Constructing%20a%20Core%20Portolio%20Pt2.pdf?dl=0
David
The Elements of Investing: Part I
The Elements of Investing: Part II
The Elements of Investing: Part III
Discover more from ITA Wealth Management
Subscribe to get the latest posts sent to your email.
Here is the link to several allocation options using the four ETFs described in this blog post.
https://www.portfoliovisualizer.com/backtest-portfolio?s=y&timePeriod=4&startYear=2005&firstMonth=1&endYear=2021&lastMonth=12&calendarAligned=true&includeYTD=true&initialAmount=10000&annualOperation=0&annualAdjustment=0&inflationAdjusted=true&annualPercentage=0.0&frequency=4&rebalanceType=4&absoluteDeviation=5.0&relativeDeviation=25.0&reinvestDividends=true&showYield=false&showFactors=false&factorModel=3&benchmark=-1&benchmarkSymbol=VTHRX&portfolioNames=false&portfolioName1=Portfolio+1&portfolioName2=Portfolio+2&portfolioName3=Portfolio+3&symbol1=VTI&allocation1_1=25&allocation1_2=60&allocation1_3=70&symbol2=VNQ&allocation2_1=25&allocation2_2=15&allocation2_3=15&symbol3=TLT&allocation3_1=25&allocation3_2=20&allocation3_3=10&symbol4=GLD&allocation4_1=25&allocation4_2=5&allocation4_3=5
Lowell