Stairway to the top of the forest canopy in Peru.
While I’m a few days early updating the Copernicus, I need to insert this analysis into the mix for several reasons – new readers at the top of the list. Before anyone is overwhelmed with the various management tools, pay attention to this passively managed portfolio. There are two passive portfolios tracked on the ITA site. The Schrodinger is the other and it is handled differently than the Copernicus. Both should be included in your family portfolio.
Copernicus Investment Recommendations
The basic thesis of the Copernicus is to save, invest in U.S. Equities, and never sell. When cash becomes available, add a few more shares of any of the four ETFs. VTI, ESGV, SPY, and VOO overlap so one could easily select one or two from these four ETFs.
Pulling the tranche worksheet out of the Kipling spreadsheet we have the following information. If I set the Maximum Number of Assets to two (2) and set the model to Buy-Hold-Sell (BHS) you will see two Hold recommendations with a bright yellow background. The recommendation is to definitely hang on to VTI and ESGV. The two remaining Hold recommendations with the blue-gray background are up to the money manager. SPY and VOO are not a definite hold. Since the underlying logic for operating the Copernicus is to never sell, no sell orders will happen. Even if the worksheet called for a Sell, I would not sell shares as that runs against the underlying principles of the Copernicus.
One option is to hold off a tad and invest available cash in SHY, a short-term treasury. SHV is also an option, although I don’t have it listed in the Copernicus investment quiver. What I’ll likely do is set several limit orders to pick up a few shares for one or more of the equity ETFs.

Copernicus Performance Data
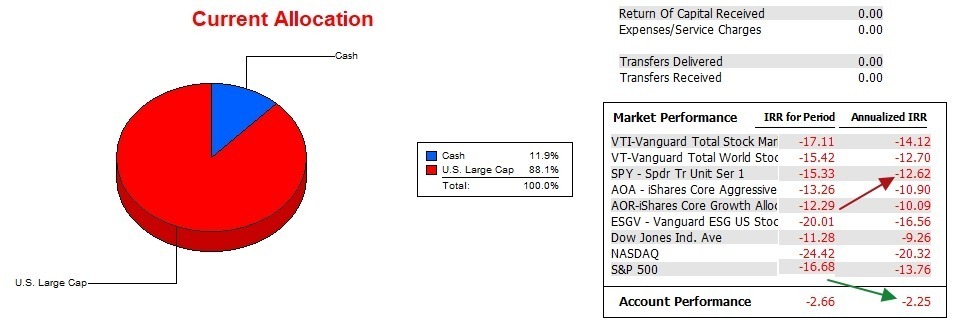
Over the past 15 months the Copernicus opened up a lead on SPY, primarily due to purchasing shares all year long in 2022 as the market dipped. This is known as dollar cost averaging. In nearly all situations when the market is in a historical upswing, dollar cost averaging works to the advantage of the investor. This is why the Copernicus is performing so well against the S&P 500 benchmark. I purchased equity shares at lower prices throughout 2022.

Copernicus Risk Ratios
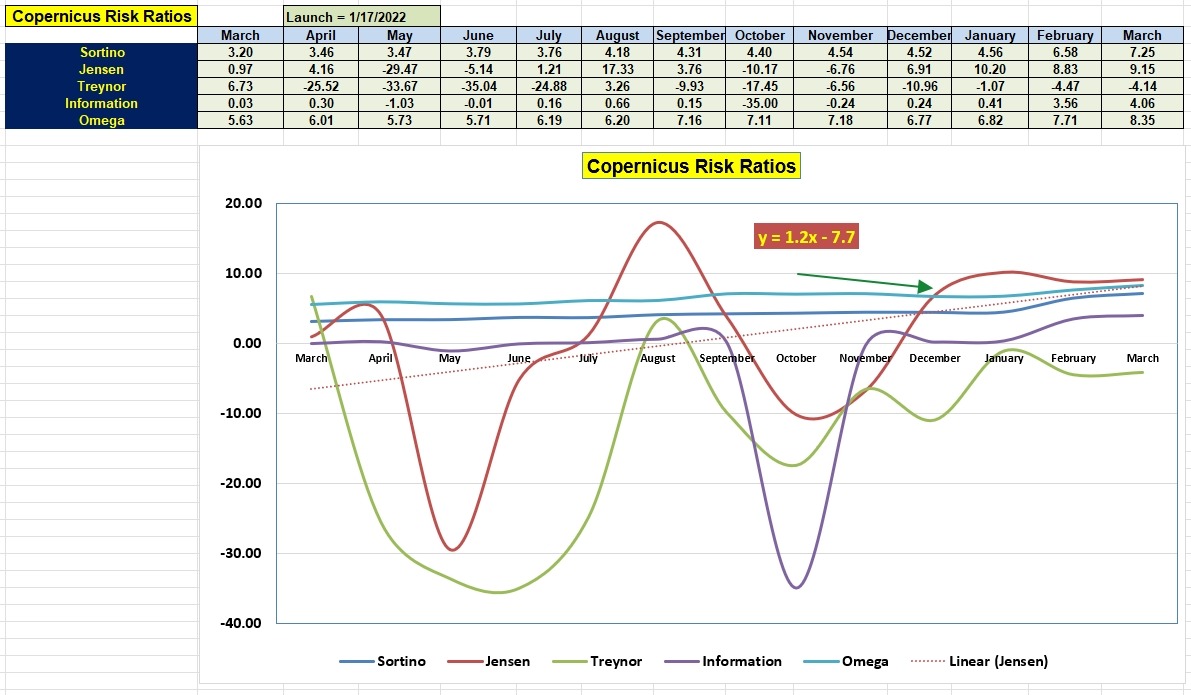
Over the past year the Copernicus only had four months where the Jensen Alpha was negative.
Of particular importance is the positive slope of the Jensen (+1.2). Again, this is due to dollar cost averaging during a poor market year in 2022.
The key to maintaining a lead on SPY is to continue to invest in U.S. Equities and that is the plan for this week.

Copernicus Portfolio Review: 11 August 2022
The Elements of Investing: Part II
Discover more from ITA Wealth Management
Subscribe to get the latest posts sent to your email.
You must be logged in to post a comment.