Bryce Canyon Area
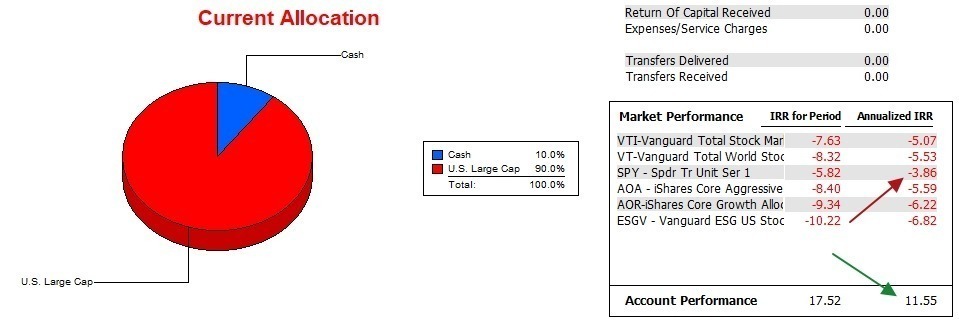
Now that we are well into July and all second quarter dividends are reported, it is time to update the ITA portfolios and record those dividends. Dividends are in short supply for the Copernicus as this is a growth oriented portfolio, not an income generator. As a growth portfolio June was an excellent month as the gains exceeded 5%.
Another plus going for the Copernicus is the argument for dollar-cost-averaging. This was particularly successful during 2022, a poor year for equities. Buying at lower prices during this negative period is now paying off as the Internal Rate of Return values are much higher than the original purchase price. Dollar-cost-averaging explains why purchasing SPY type securities ends up so much higher than SPY itself.
Copernicus Security Recommendations
Below is a worksheet from the Kipling spreadsheet. Using the BHS investing model and a maximum of three assets at a time, the current recommendation is the following.
- First fill the requirement for ESGV.
- Ranking #2 is VOO so this ETF is filled after ESGV is full.
- Third in line for filling is SHV.
SHV as a short-term treasury is an anomaly within the Copernicus. SHV is only used when the equities are either filled or not recommended. SHV is the only ETF we sell when there is insufficient cash available to fill the recommended equities.

Copernicus Manual Risk Adjustments
ESGV and VOO are over subscribed so we move to SHV or the third ranked ETF. Limit orders are in place to purchase 50 shares of SHV.
If any of the four equity ETFs showed up as a Sell, we would not act on that recommendation as the Copernicus is an experiment in holding on to equities come thick and thin. Should we have insufficient cash to fill a recommended equity ETF, we would sell shares of SHV to raise cash.

Copernicus Performance Data
Over the past 18+ months the Copernicus is meeting its goal of outperforming the S&P 500 (SPY). As mentioned above, dollar-cost-averaging is the logical reason as to why this equity oriented portfolio is performing so much better than SPY.

Copernicus Risk Ratios
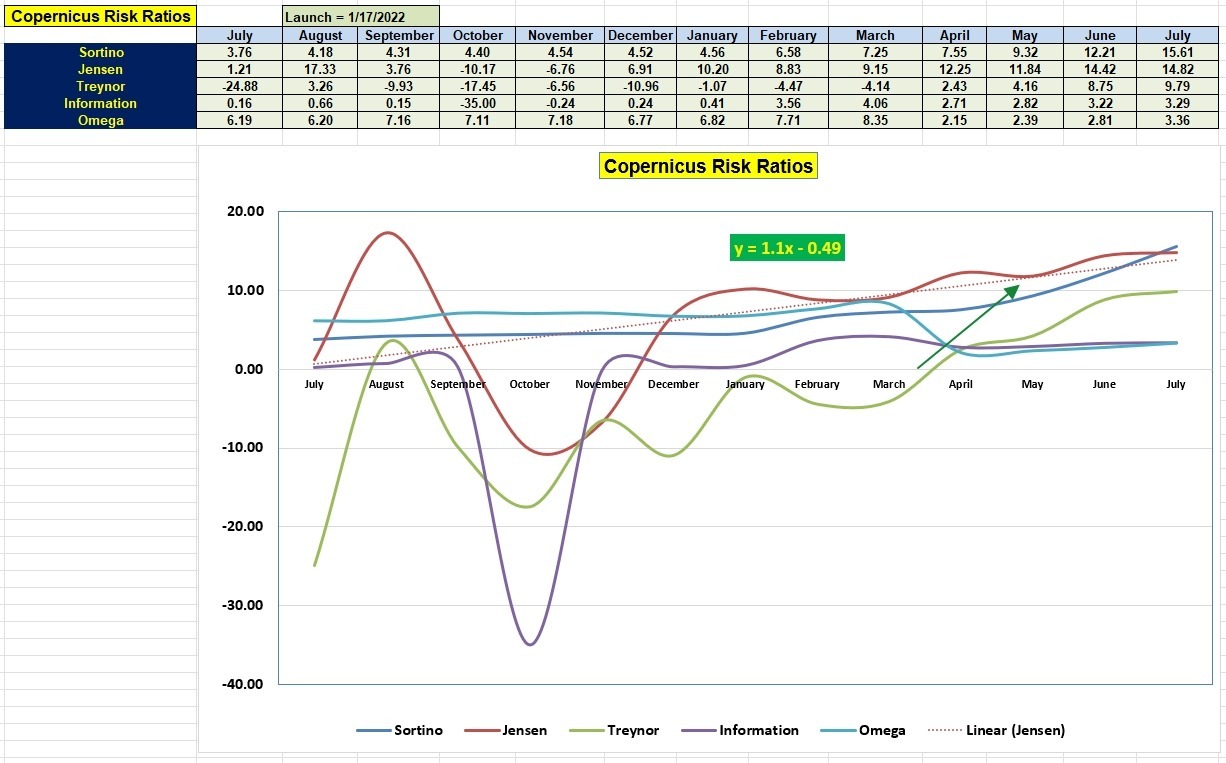
June was an excellent month for the Copernicus as we can see from both the Jensen and Information ratios. The slope (1.1) for the Jensen dropped slightly as a low value from last June was clipped from the average. The reverse will happen when the high August value is removed from the average.

Copernicus Buy & Hold Portfolio Review: 18 May 2023
Tweaking Sector BPI Plus Model: 20 May 2023
Check out this article from Seeking Alpha.
Reminder: The ITA blog is free to anyone who registers as a Guest.
Discover more from ITA Wealth Management
Subscribe to get the latest posts sent to your email.
You must be logged in to post a comment.