Cruise Ship in Darwin Harbor, Australia
The Darwin Portfolio is an “All-Weather” portfolio with a dash of volatility. Performance to date (since lowering volatility target levels last November) looks like this:
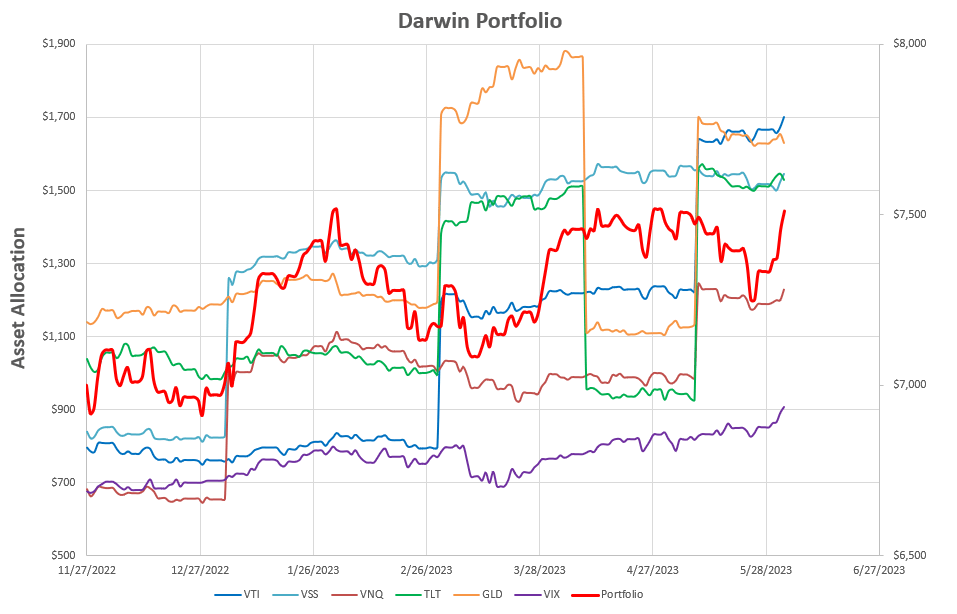 The large “jumps” correspond to periodic allocation adjustments to risk parity – but maybe the stacked chart is easier to follow:
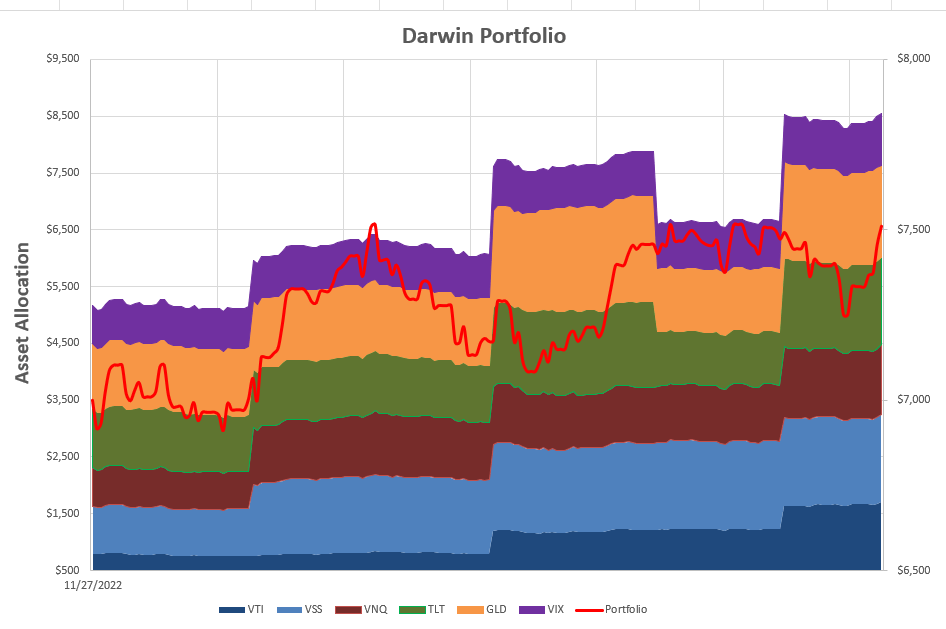 at least it is a little easier to see the relative allocations to each asset.
Although not a part of the risk parity calculations I have also added a ~10% allocation to Volatility as an asset class. This allocation (in $ terms) has not been adjusted since portfolio inception but, as can be seen in the above screenshots (purple lines/areas) , has been the most consistent (and positive) contributor to total portfolio returns.
In tabular analytical format:
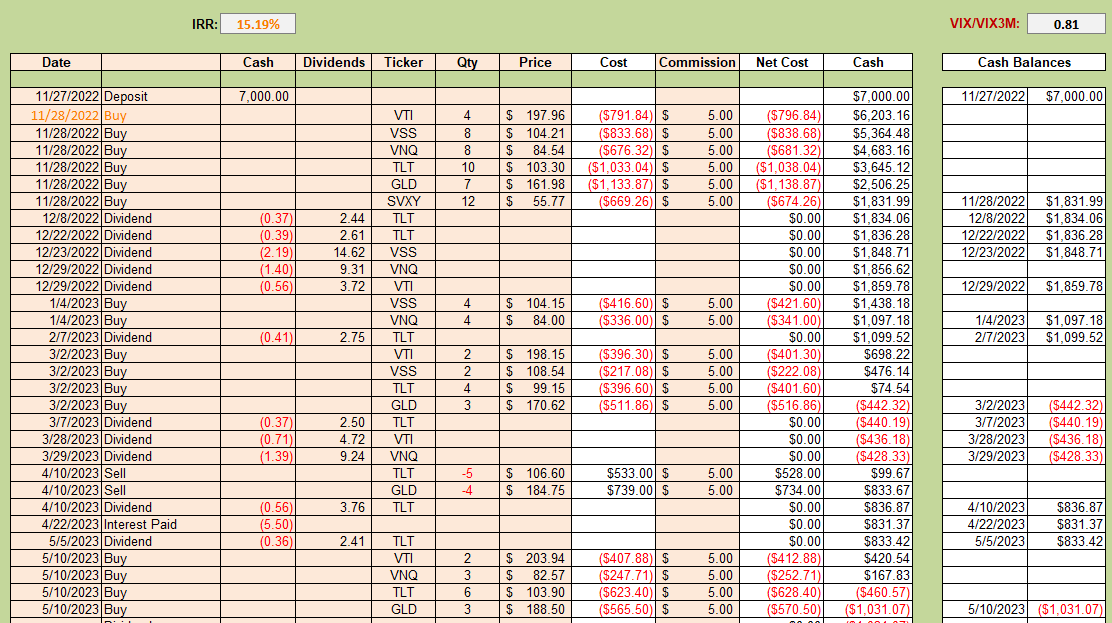 the portfolio is currently showing a healthy 15% annualized Internal Rate of Return (IRR). Of course, this is only over a 6-month period, so needs to be taken with a healthy grain of salt (if that is even healthy 🙂 )
Analysis this month shows the following picture:
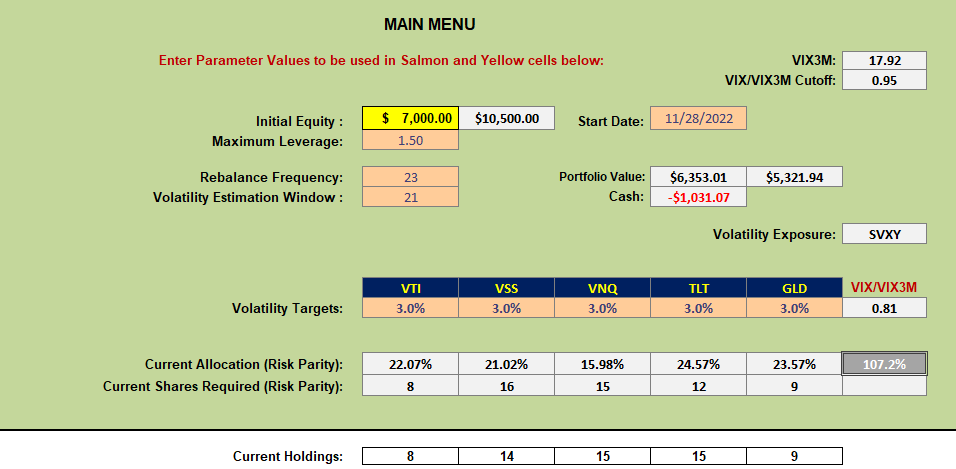 where we see current allocation recommendations close to current holdings – although TLT is slightly off-target by 3 shares – but I’ll ignore that, this month, to avoid commissions on a relatively small account. Remember, also, that this portfolio is analyzed/adjusted to allow up to 50% margin. At present the portfolio is leveraged up to ~15% margin.
I will not be making any adjustments to this portfolio for at least another month.
David
Discover more from ITA Wealth Management
Subscribe to get the latest posts sent to your email.
You must be logged in to post a comment.