
Smith Rocks – Central Oregon
Franklin is the Sector BPI portfolio scheduled for review this morning. A number of months ago this portfolio was a “laggard.” Improvement began when this portfolio was moved to the Sector BPI Plus investing model. Follow the analysis below for additional information.
Franklin Investment Quiver and Holdings
The Franklin currently holds shares in the five oversold sectors which are: Discretionary, Staples, Health, Utilities, and Real Estate. Materials (VAW) is still close to the oversold zone so I added two shares this morning. Cash is limited as you can see from the following screenshot.
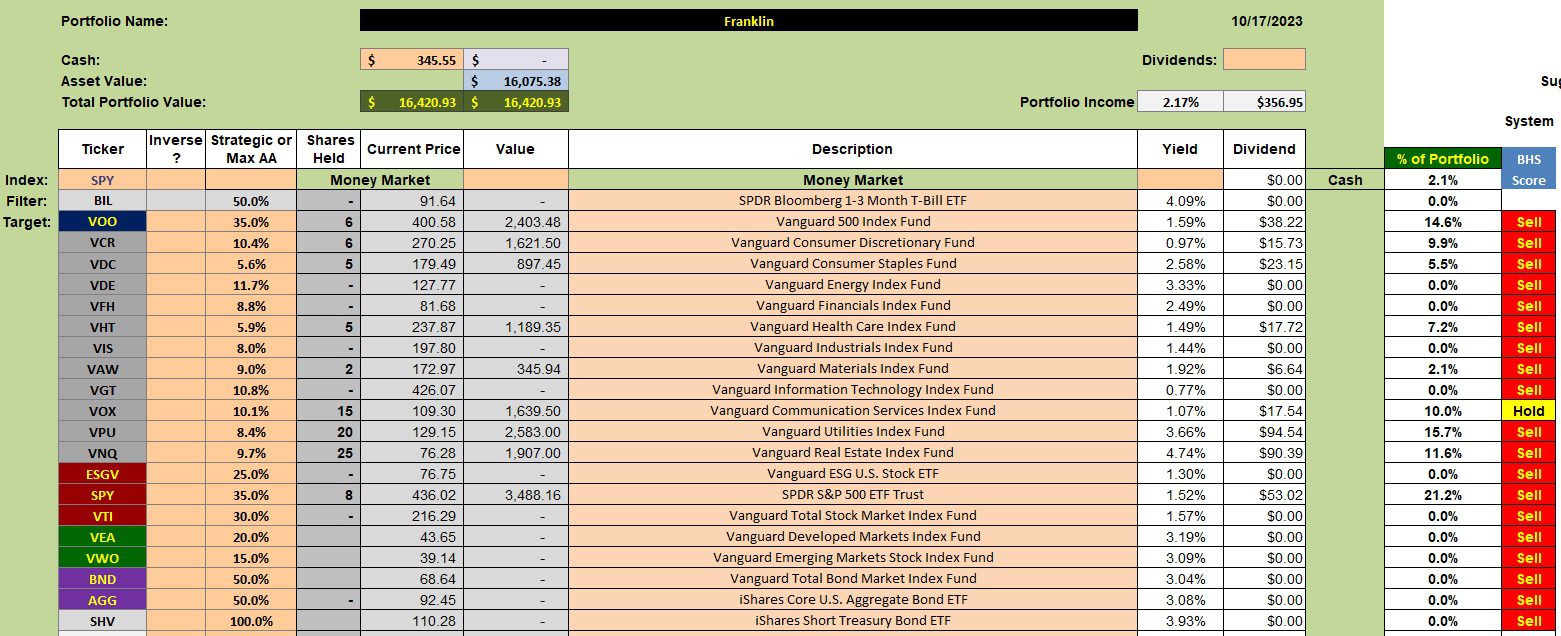
Franklin Security Recommendations:
None of the U.S. Equities are recommended when the model is set to BHS and the default look-back period is used. When this is the case all available cash is used to purchase the oversold sectors. The Franklin is currently constructed around this logical model.
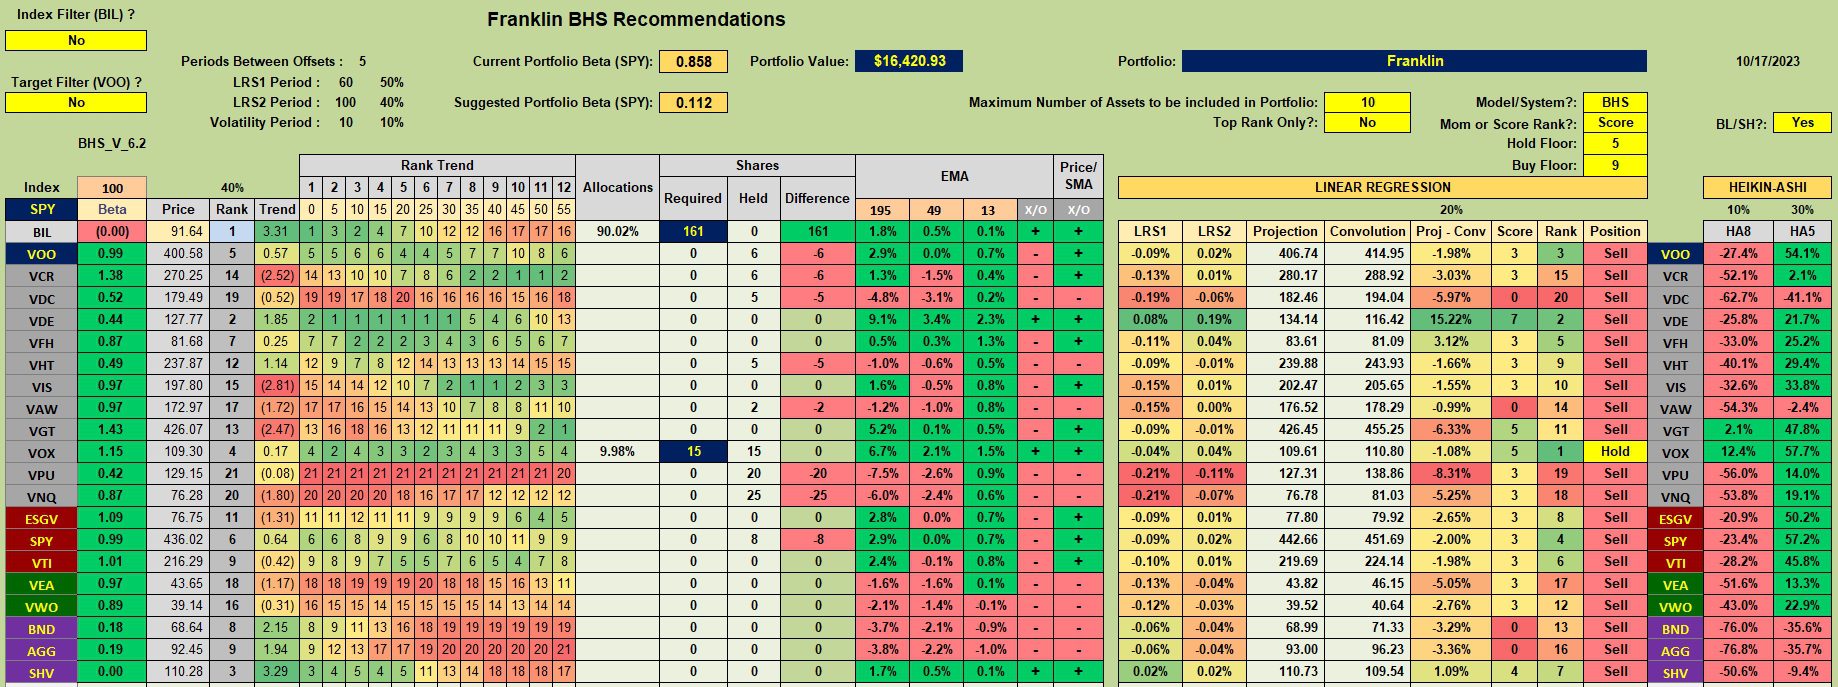
Franklin Manual Risk Adjustments
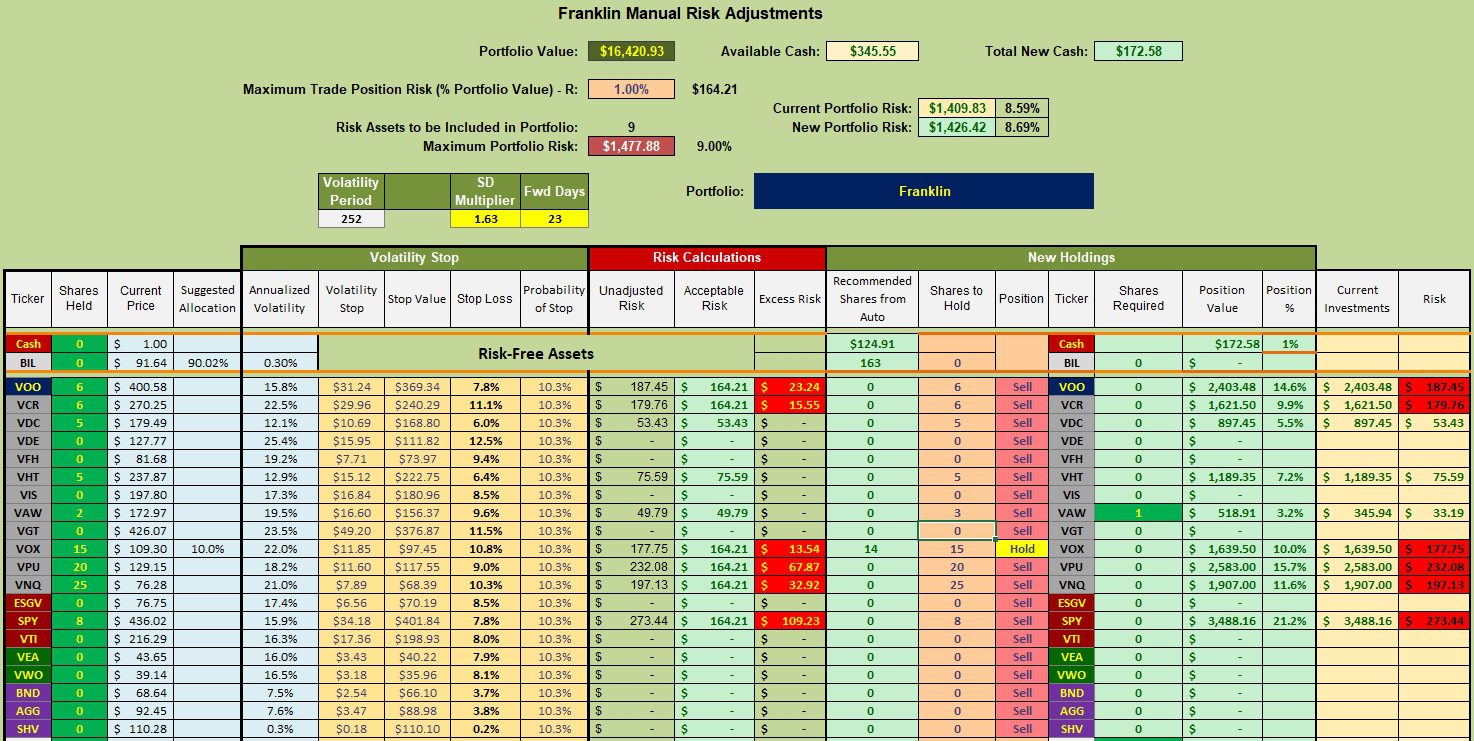
With the small amount of cash available I have a limit order set to add to Materials (VAW). Otherwise the Franklin is set for another month of operation. We are likely several months away from any of the sectors moving into the overbought zone.
Franklin Performance Data
The Franklin holds a slight edge over the SPY benchmark as we come up on 22 months of data. The delta difference becomes significant when we check the other five potential benchmarks.
Franklin Risk Ratios
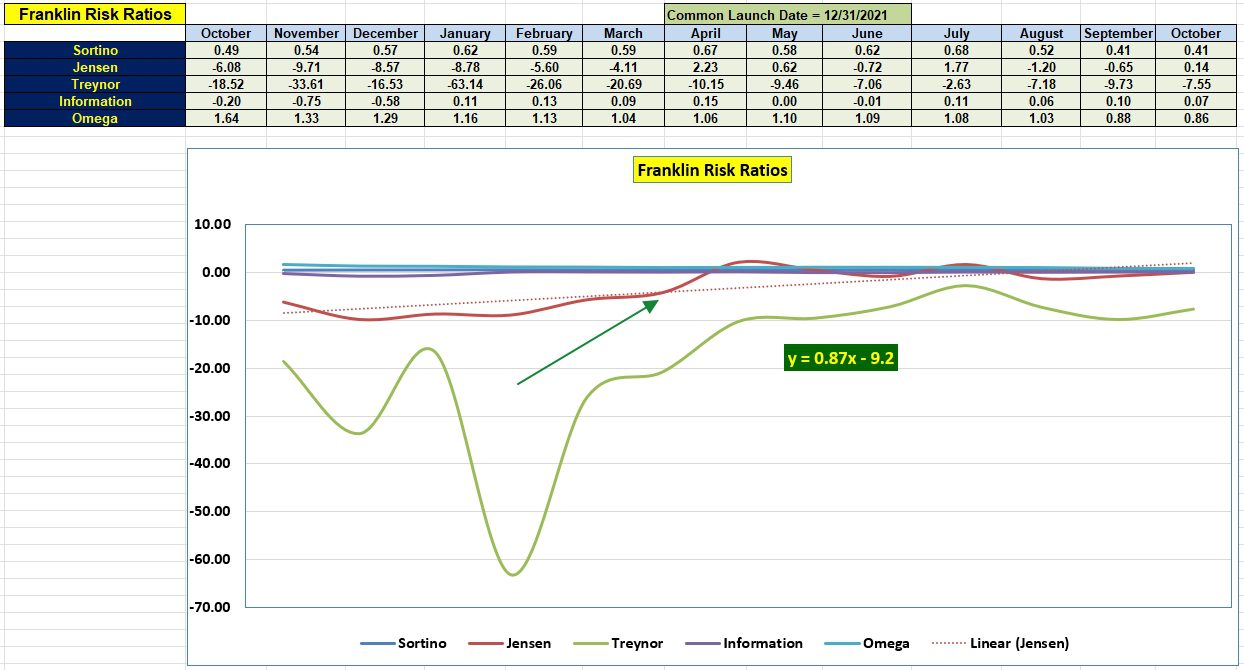
Note that the Franklin moved the Jensen needle from negative to positive this month. This move is significant as short-term interest rates continue to rise putting downward pressure on the Jensen Alpha. The trend of the Jensen is also positive for the past year. Only the Sortino and Omega Ratios are lower than they were last October.
Franklin Performance Report
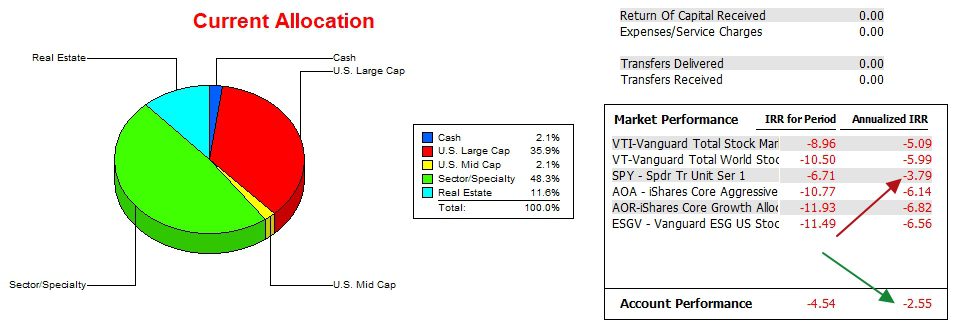
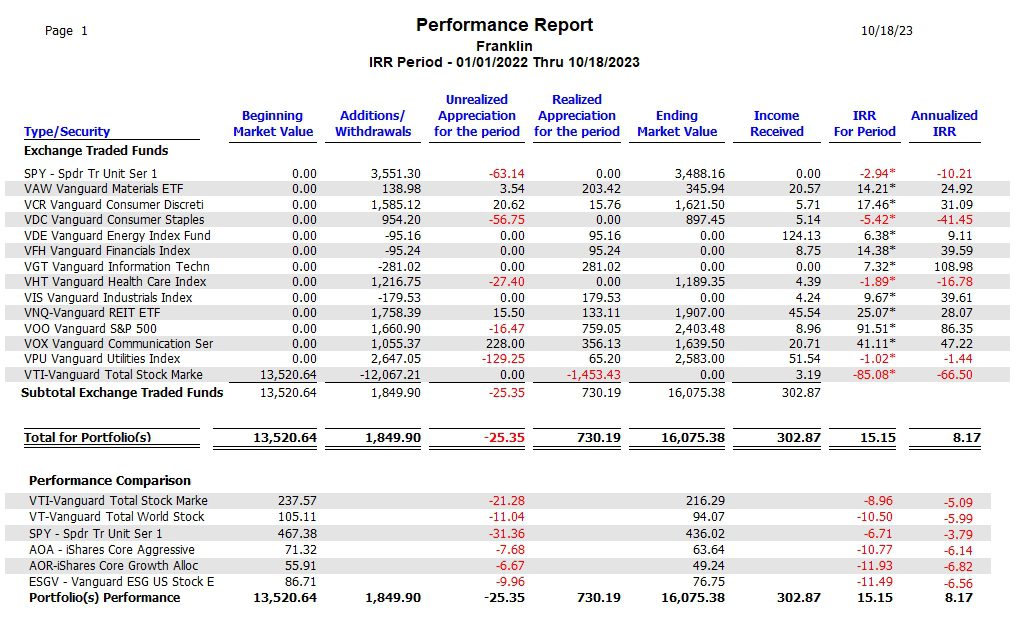
While it is still too early to get too excited, the following Performance Report is encouraging. This data comes out of the Investment Account Manager (IAM) software. As you can see, the vast majority of the sectors held in the Franklin since early 2022 are positive and have added value to the account.
I still need to see several Buy and Sell cycles to gain additional confidence in the Sector BPI model. Early results are sufficiently encourage to where I am seriously considering moving the two worst performing portfolios over to the Sector BPI model.
When I constructed the following table I missed adding ESGV, one of four U.S. Equity ETFs used with the Franklin. All eleven sectors are part of the data table.
If ITA readers have questions related to the Sector BPI Plus investing model, place them in the comment section and I’ll answer as quickly as possible.
Lowell
Discover more from ITA Wealth Management
Subscribe to get the latest posts sent to your email.
You must be logged in to post a comment.