
Barbary Macaques Monkeys, Gibraltar
Portfolio Construction
The following screenshot tells us almost all we really need to know about 2021 – it was a great year to invest in US equities:
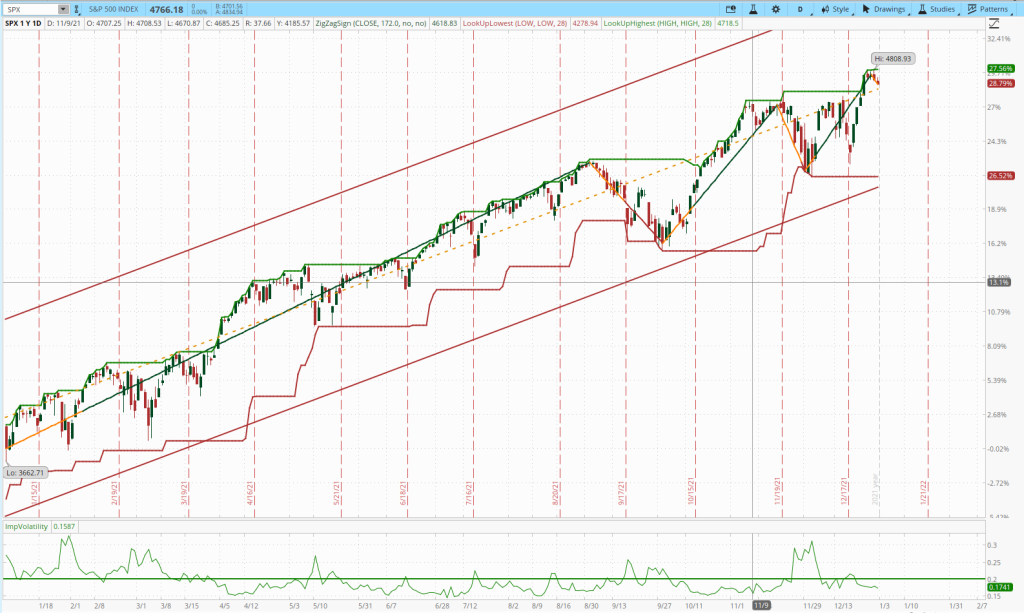
The S&P 500 Index was up 29% on the year with 70 new highs on the way up and only two (short-lived) corrections of over 4%. Likewise, the Nasdaq Index was up 29% and the Dow 20%. Only the Russell 2000 (small-cap) Index lagged a little with a 15% gain. In retrospect a Buy-And-Hold investment in any Fund tracking US equity markets would have served us very well – our favorite ETF, VTI, that covers the broad US equity markets gained 26% on the year.
However, there were better (asset class) performers – Oil was a big mover in 2021 with USO (the Oil-linked ETF with highest Assets Under Management – AUM) being up 80% in October. It has since pulled back a little but still returned ~70% on the year:
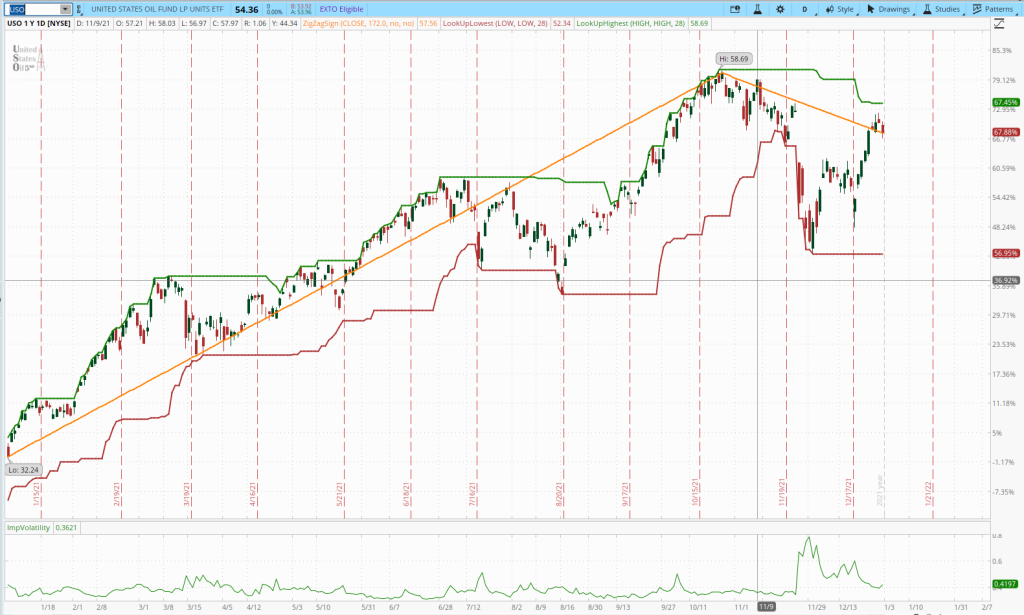
IEO, BNO, USL and OIL are other Oil-linked ETFs that showed gains in excess of 60% in 2021 and that we might want to consider if looking to add Oil as a diversifier to our portfolios – but, of course, we may have missed the boat here.
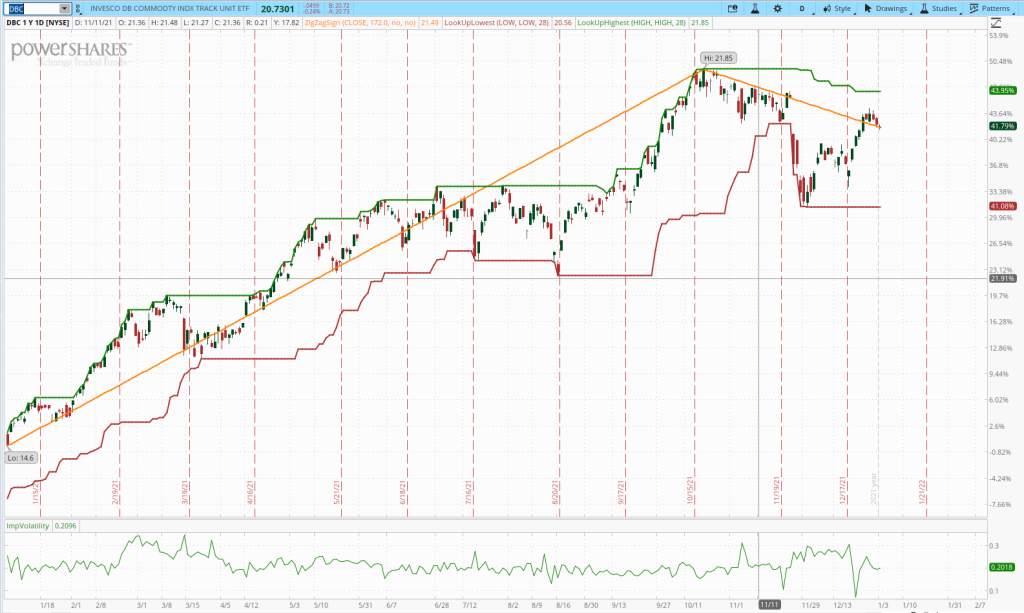
In the Rutherford asset quiver, I include DBC as a commodity ETF that covers Oil – but it is more diversified and includes other commodities, so it did not have quite as good a year in terms of performance – although still showing a ~40% return – ahead of US equities:
When looking for diversification through commodities – especially with a threat of inflation – it is common to consider holdings in Gold. But Gold (GLD) has not responded in 2021:
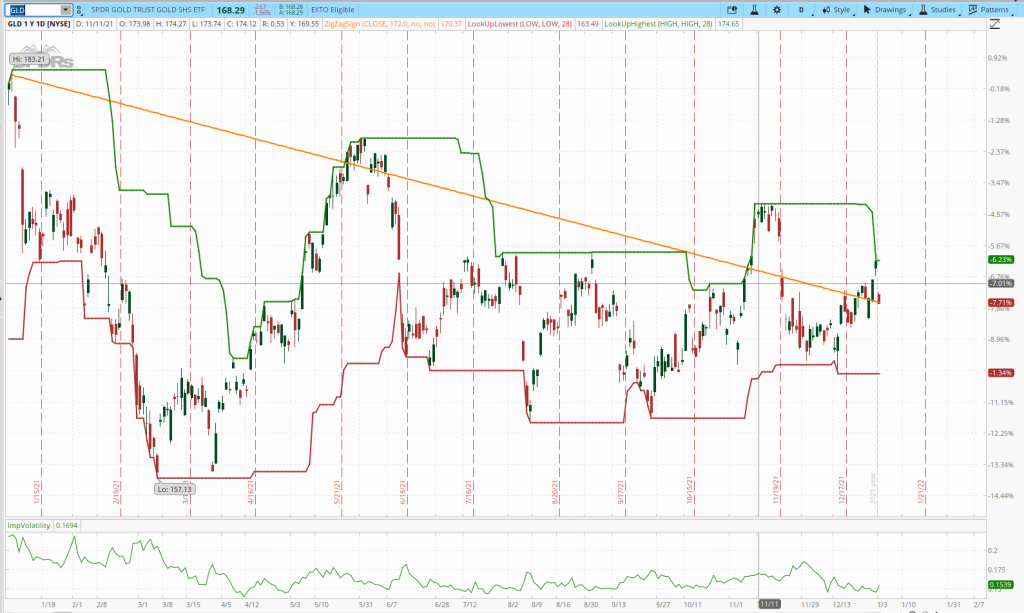
Whilst trading sideways for most of the year it is still showing a ~7% loss from its 2020 closing price. Will this change in 2022 if the inflation threat continues?
Treasuries (and other bond ETFs) were also poor performers over the past year. TLT, the 20-Year Long-Term Treasury ETF ended 2021 with a ~7% loss after recovering, partially, from a ~15% correction early in the year:
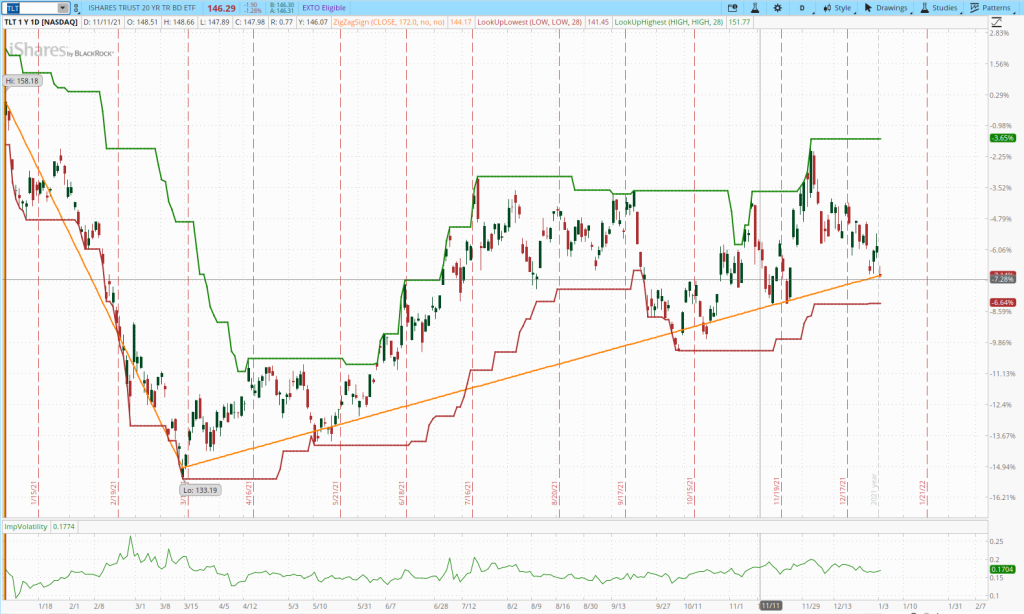
Other Bond funds behaved similarly.
The last major asset class that we often include in our portfolios is Real Estate. Our most popular choice here is VNQ that also had a stellar year generating a 40% return with no major draw-downs/corrections:
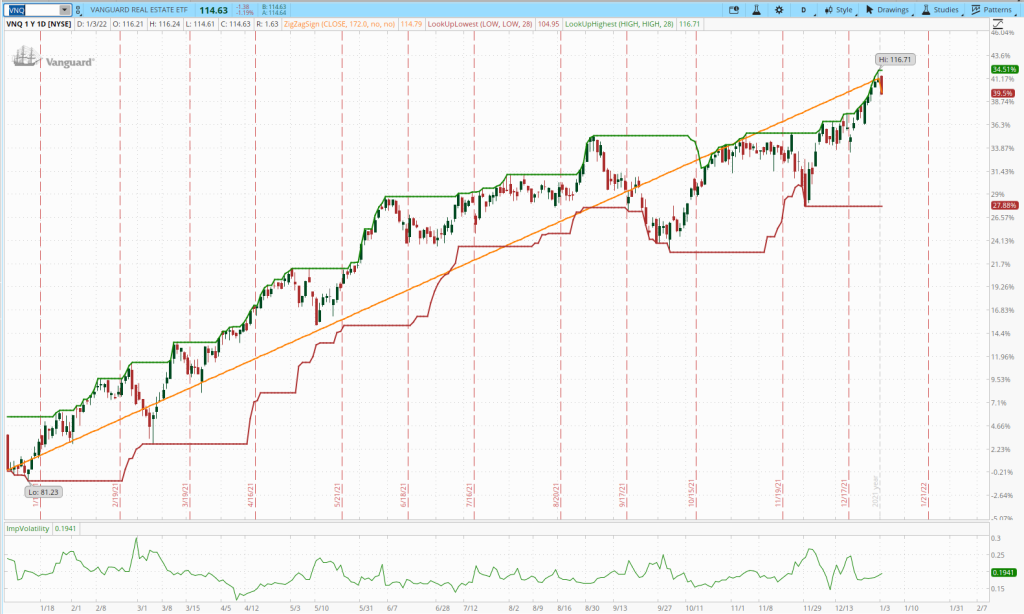
So, despite the high performance of the US equity markets, this performance was beaten by Real Estate and Commodities (at least if the Fund chosen included Oil). Bonds were the assets dragging down the returns of diversified portfolios. Diversifying geographically did not offer any significant advantages in 2021 in terms of enhancing returns although probably lowering risk (volatility). International equities showed modest single digit gains that were offset by similar losses in the bond markets.
Portfolio Management
Given the above performance we might have expected diversified portfolios to perform at least moderately well in 2021 – maybe generating returns in the high teen percentage range. So, let’s check in on the Rutherford Portfolio that diversifies through all the asset classes noted above:
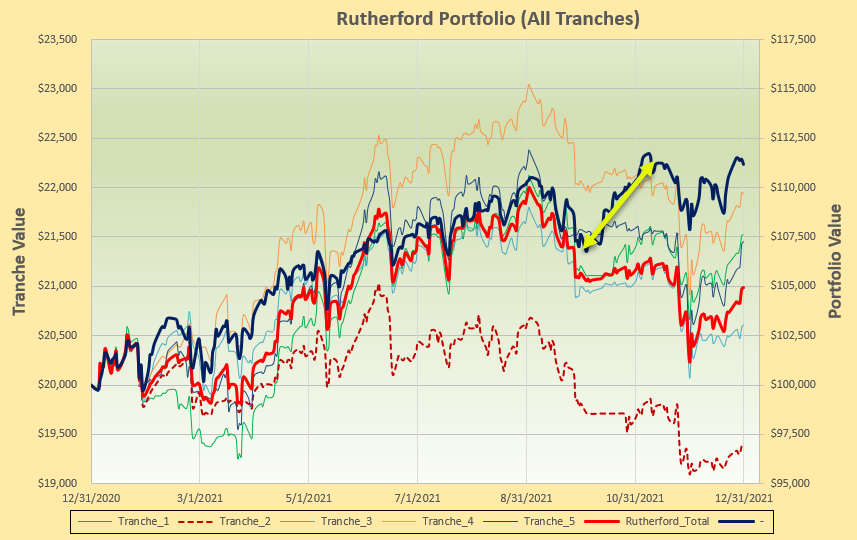
Here, we see very disappointing performance with an annual total portfolio return (heavy red line) of only 5%. So, let’s analyze this performance to see if there are any lessons to be learned.
The first thing to note is the wide range of performance between the five tranches into which this portfolio is broken down – with each tranche being reviewed/adjusted on a five-week schedule with one week between the five tranche review periods. The best tranche performance (top thin amber line) shows a 10% annual return whilst the worst performing tranche (lower dashed brown line) shows a 3% loss. This demonstrates the significance of review-date (or timing) luck. So, we have to make a decision as to whether we will review/adjust the portfolio only once a month (on a monthly schedule) and trust to luck as to where our performance will fall within this range – or whether we will split the portfolio into tranches and review different tranches on a weekly rotation schedule – thus averaging our luck over time. Or maybe just review the total portfolio more frequently – although this introduces the possibility of more whipsaw trades and “churning”. Factors that might influence an investor’s decision here might be aversion to risk and/or tax situation (avoiding short-term “wash-sale” rules).
However, even if we had been “lucky” and fortunate enough to fall on the top (amber line) schedule our annual return would still have been “only” 10% and we might still be disappointed. So, what else do we notice from the above plots? An obvious feature is the dislocation of the portfolio equity curve (heavy red line) from the benchmark equity curve (heavy blue line) in early October. This was a result of Trailing Stop Loss Orders (TSLOs) being hit and getting taken out of VTI (US equities) in all five tranches. Even based on the performance of our diversified benchmark fund (AOR) we clearly lost ~6% as a result of this action. Since VTI was held in all portfolios this means that the best performing tranche might have been expected to generate at least an additional 6% – or a 16% annualized return – had we not been using stop-loss orders. Adding 6% to the 5% realized by the Rutherford portfolio would have resulted in an 11% return – in line with the return from the benchmark fund – and this is probably about where this portfolio should have ended. The decision here is whether we are prepared to give up (significant) returns in exchange for reduced downside risk. Momentum systems will get us out of major corrections on our review dates but, depending on luck, we might have to accept drawdowns of 10-20%.
To demonstrate that this is not a one-off, single portfolio example, let’s look at the performance of the Kahneman-Tversky Portfolio:
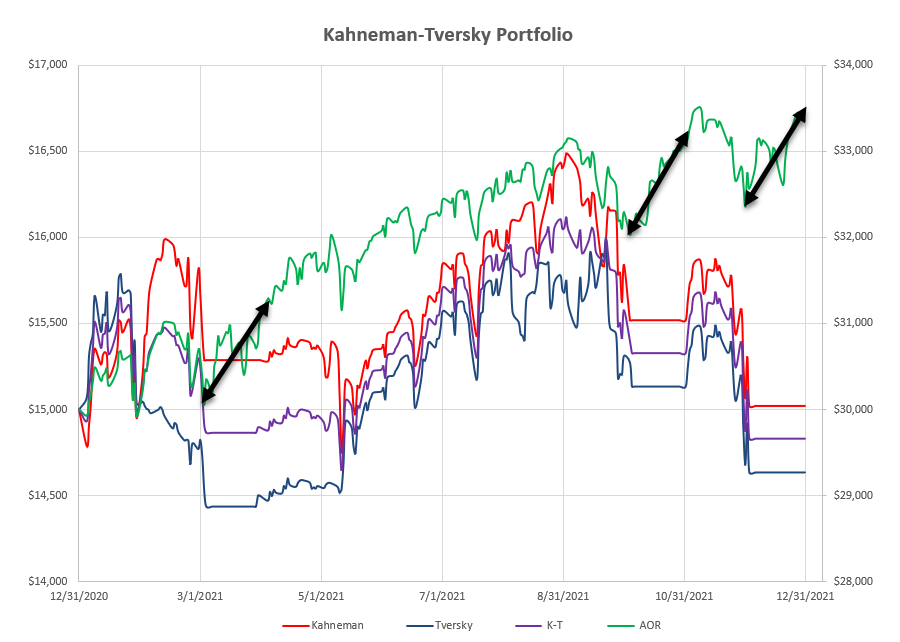
TSLOs were also used for this portfolio but were a little tighter than for the Rutherford Portfolio. This means that individual losses per instance were smaller (~3-4%) – but there were more of them – three in the 12-month period. This resulted in ~10-12% lost in potential returns (~value of returns generated within the periods shown by the black arrows). One thing that I have realized from this example is that TSLOs are not particularly attractive when used with Dual Momentum (DM) portfolios since, with a restricted choice of assets (usually only 3), it is difficult to re-enter the market quickly – presumably we wouldn’t want to jump back into the same asset that we had just been stopped out of – even if seeing a BUY signal – otherwise why would we be exiting in the first place? This portfolio managed to lose a few dollars in 2021 – so, a bit of a disaster despite the strong performance from May – September.
Investment Models
At ITA Wealth we cover a range of possible investment models for consideration. There is often the temptation to look for the “best” model based on recent performance. But this is not a good idea – most well-designed systems work well – until they don’t! It is far better to diversify across different systems/models (in addition to diversification of assets within the portfolio) than it is to seek out the “best” system.
If we check Lowell’s performance update for 2021 (https://itawealth.com/performance-update-31-december-2021/) we get an idea of the range of performance that we might expect.
Buy-And-Hold (e.g. Schrodinger) worked well in 2021 because we saw a relatively smooth bullish trending market. These portfolios need little or no management but offer no downside protection in the event of a significant draw-down.
Dual Momentum portfolios are simple and easy to manage but tend to be very sensitive to “luck” – some generated returns at the top of the list (McClintock and Pauling) whilst other (Franklin and Kahneman-Tversky) ended up at the bottom of the pile. Another reason to diversify across systems/time.
Other models available within the Kipling workbook (LRPC, HA and BHS) are momentum-based (Cross-Sectional or Relative Strength) models designed to perform best with market conditions changing at different speeds – so, again, since we can’t know what the next year will bring it is probably prudent to spread risk between different systems. Overall, these systems performed well over the past year generating returns in the 10-30% range depending on timing “luck”.
I haven’t covered “Income” portfolios in this retrospective but these represent yet a different investment philosophy that offers even more diversification – and these have performed well in 2021 with returns in the high teens. Be sure to follow our posts (Hawking https://itawealth.com/hawking-portfolio-review-31-december-2021/ , Huygens https://itawealth.com/huygens-portfolio-review-6-december-2021/) that use this methodology to learn more about some of the pros and cons of the approach. It is a significantly different approach from our other models.
I also haven’t mentioned the Darwin Portfolio (https://itawealth.com/darwin-portfolio-review-23-december-2021/) that uses risk parity allocations to target volatility (risk) and represents a “core” portfolio with holdings in all assets in the investment quiver, but which is rebalanced periodically to maintain stable risk-adjusted performance. I am still working on this portfolio to (hopefully) better control the risk level and, maybe, to provide more system diversification.
One of the ideas that I have been working on for the past few months is the concept of treating Volatility as a separate asset class in it’s own right. This is a little difficult from an “investor” point of view because of the speed at which volatility can change – it is a little easier if accepted as a system to “trade”. Check the post at https://itawealth.com/using-volatility-as-a-diversifier-and-a-portfolio-hedge/ for a description of one of these new systems. Even for systems that might trade infrequently these systems need frequent (daily) attention to market conditions because of the rate at which things can change. Because of the characteristics of volatility products that can be traded, these systems are (potentially) suitable for use as a hedge for more conventional portfolios. In that vein I also continue to look for efficient ways to use Options as a portfolio hedge – without incurring excessive “insurance” costs.
Where we go in 2022 remains to be seen – but it is difficult (yet not inconceivable) to imagine the bullish trend in US equity markets continuing at the same pace as in 2021. Until we see evidence to the contrary, we should probably remain bullish (long equities) but be prepared to go on the defensive if/when there is evidence of weakness. Some gurus are suggesting that we are living in conditions very similar to those in existence at the time of the 2000 tech bubble – and they may be right. But, although the pandemic has caused a lot of economic damage, there is still a lot of money going into the markets – must be nothing else to spend it on when we can’t go anywhere.
I’ve been worried since 2013 😊 – but we’re still in an uptrend despite the pandemic scare. It’s just a matter of time before we see a major correction – as markets continue upwards at these rates the bubble gets bigger and the louder will be the bang when it does finally burst. In the meantime, we need to be a little careful without getting too paranoid.
David
Discover more from ITA Wealth Management
Subscribe to get the latest posts sent to your email.
David,
Thank you for providing this introspective to 2021. I like your title and was curious why you used a monkey for the the photo header? Perhaps good luck or should we “see no evil”? As we all know, higher reward involves higher risk (eg drawdown). I think the application of TSLO’s needs a deeper dive in the context of how much risk an investor is comfortable with. One of the higher performing portfolio’s was McClintock, a DM portfolio. Unless I am mistaken Antonacci does not mention the use of TSLO’s. I wonder if there is a “sweet spot” standard deviation that protects from an unacceptable drawdown but keeps us in the market? Is it possible to have a high performance well diversified portfolio where we can achieve market like returns without suffering the whipsaws of the market? Often, in the backtesting I do search for the holy grail of diversified portfolios, they don’t do much better than the VBI index fund. Just my 2 cents (Oh, Canada doesn’t use cents anymore!). Thanks again for all the great insight you provide us ITA followers.
Phil
Phil,
I hadn’t thought about the luck aspect of the monkey – but checking the Chinese horoscopes the advise is:
“don’t invest and manage your money without due consideration, otherwise you will lose a lot of money and your losses will outweigh your gains. You should choose to invest in stable markets such as real estate, and don’t buy risky stocks.”
also:
“This year will be a good time to expand into overseas markets. You must strive to seize your opportunities and, at the same time, analyze the risks that may arise.”
Certainly “see no evil” but also maybe a suggestion that we need to protect future generations?
The actual reason was that, not being able travel very far from home, I’m running out of photographs other than those taken in Germany or Utah! I’ve gone to check some older files – but they’re at lower resolution – but at least that won’t take up as much of Lowell’s storage space 🙂
In the past year I’ve tried to find a “sweet spot” for TSLOs by using levels of 1 SD, 1.65 SD and 3 SD in various portfolios – but I can’t say that there is a sweet spot. I think 1 SD is too tight (K-T Portfolio) and 3 SD, while ok most of the time (when pullbacks are smooth and “rational”) , also fails when prices spike down sharply (for whatever reason). This may be more a result of using these stops with a portfolio of CEFs (Hawking), that are more thinly traded than the popular liquid ETFs, and therefore more prone to “manipulation”. If I had to pick just one level it would be the 1.65 SD stop since this has a reasonable 10% probability of getting hit – it also, generally, sets the stop-loss level at ~8% for US equities (with volatility at “normal” levels). This is a level often suggested by investment publications such as Investors Business Daily (IBD) and other “gurus”.
David
Phil,
In general, I do not use TSLOs with the Dual Momentum portfolios as the model is built to handle market draw-downs. That does not mean I never use them, but it is not my general practice. You are correct, Gary Antonacci does not mention using TSLOs.
Lowell
Phil,
I hadn’t thought about the luck aspect of the monkey – but checking the Chinese horoscopes the advise is:
“don’t invest and manage your money without due consideration, otherwise you will lose a lot of money and your losses will outweigh your gains. You should choose to invest in stable markets such as real estate, and don’t buy risky stocks.”
also:
“This year will be a good time to expand into overseas markets. You must strive to seize your opportunities and, at the same time, analyze the risks that may arise.”
Certainly “see no evil” but also maybe a suggestion that we need to protect future generations?
The actual reason was that, not being able travel very far from home, I’m running out of photographs other than those taken in Germany or Utah! I’ve gone to check some older files – but they’re at lower resolution – but at least that won’t take up as much of Lowell’s storage space 🙂
David
Hi David Thanks for the splendid piece. At one point you confessed that “I’ve been worried since 2013.” I have been worried since I was born. As a result, I suffer from the damaging Loss Averse Bias which haunts many of us. Based on my haunches about what will happen in the US this next year I am already shaking in my boots and planning defensive strategies. One strategy is to begin using TSLOs much more frequently than I have in the past. Hence I found your ideas on TSLOs very instructive. However, I am reminding myself that trusting my hunches and about the future is pure
insanity so I will work at not going overboard with TSLOs. Thanks again for your good work. John
David,
Thanks for the review. Now I don’t feel so bad about not matching the market – not even close.
You asked about whether you should continue the Rutherford tranche reviews in an earlier post. Have you thought about continuing the weekly Rutherford review, but with the entire portfolio, rather than using tranches? The idea would be that changes to the entire portfolio would be more responsive to changes in the market. If reviewed on a weekly basis, to mitigate potential churning issues you could choose not to sell an ETF so long as the HA’s continue to be green, or using Lowell’s practice of setting 1/2 or 1/4 of the spreadsheet TSLOs for those ETFs registering as Holds.
I suspect one of the “problems” we’ve had with using TSLOs this past year is that equities that fell sharply also recovered sharply. This occurred three or four times since August. A subsequent purchase of the same equity (e.g., VTI) that might have been sold using a TSLO might have been re-purchased at a price significantly higher than the sold price. I guess one of my questions would be: are sharp recoveries the norm? If so, I think using the HAs or Lowell’s strategy might make sense. Thoughts?
~jim
Jim,
I feel that I’m always reminding readers of the significance of review-date (timing) luck – and I don’t want to get on everyone’s nerves by repeating it every week. But performance fluctuations due to timing are significant (13% difference for the 5 Rutherford tranches) and an important aspect of investment for us to recognize/consider. The tranche methodology isn’t perfect but it does smooth the equity curve and reduce total portfolio volatility (even if lowering returns – for “lucky” investors). If we were only to review quarterly or annually then the significance of luck (maybe) reduces a little.
One of my “criteria” when considering what I might write about in these posts has been to assume that most readers prefer to review/adjust their portfolios no more frequently than once per month. Obviously, this is not my personal preference, and I do deviate from this “ground-rule” somewhat, but that was a requirement that I felt was most consistent with Lowell’s objectives for the Blog (It is Lowell’s Blog so he should set the rules). This is why I asked for feedback on whether anyone would miss the tranche reviews.
Yes, I have considered a weekly review of the total portfolio but I’ve rejected it based on the probability of whipsaw trades – short-term reversions are common and limiting these to a portion of only 20% of the portfolio is more appealing to me than getting frustrated when at least 20% of the portfolio is affected. Also, the benefits of legging into/out-of holdings in individual assets is also appealing to me.(on average).and helps smooth the “luck”. Of course, not all my portfolios are tranched – too much work and not enough time – and for these I tend to prefer End-Of-Month reviews – but this gets the work-load stacked up too. In addition, ITA Wealth readers would be bombarded with more posts than they could get through if both Lowell and I did this – with nothing else to read/absorb for another month. If I am going to move away from the tranche methodology I will likely move to a more frequent (daily) check of the portfolio – it doesn’t take much time/effort to download data and take a quick look to see if anything has changed – and to consider possible adjustments at any time of the month. Since the objective is still to “invest” rather than “trade” it shouldn’t matter too much if it takes me a couple of days to think about things (Kahneman-Tvesky – Thinking Fast and Slow) before adjusting – adjustments might/might not be more frequent than monthly and the methodology might encourage more attention to short-term changes without knee-jerk reactions.
Regarding TSLOs – I still don’t like using them (but at least it’s an available band-aid – if you can take the possible pain of pulling them off). Your question of recovery time is a very good/interesting one. I would say that sharp recoveries from corrections/draw-downs are not the (historical) norm – at least until more recently. It took us ~ 4 years to recover from the (1-year) 2008 Financial crisis but the 2018 and 2020 corrections were followed by V-shaped recoveries that were much quicker. Recent more minor corrections have also shown the same rapid (V-bottom) recovery (https://www.dropbox.com/s/aod1nbnn5i5ujnn/2022-01-04_16-56-10.png?dl=0) – so maybe thangs have changed/are changing – and we may have to find the best way to deal with this. On my “Work-In-Progress” schedule is a project to combine fast and slow systems into a portfolio model that might help account for these situations.
David