
Carr Fire Sculpture
The often touted Schrodinger is again up for review. I started this portfolio a few years ago as a test to see how a computer managed portfolio might perform compared to other investing models. As a result, one can use the Schrodinger or a similar Robo Advisor portfolio as a management benchmark. How are the other portfolios performing compared to this “Intelligent Portfolio” managed by a Schwab computer algorithm? That question is answered when I post comparative performance data.
Schrodinger Investment Quiver
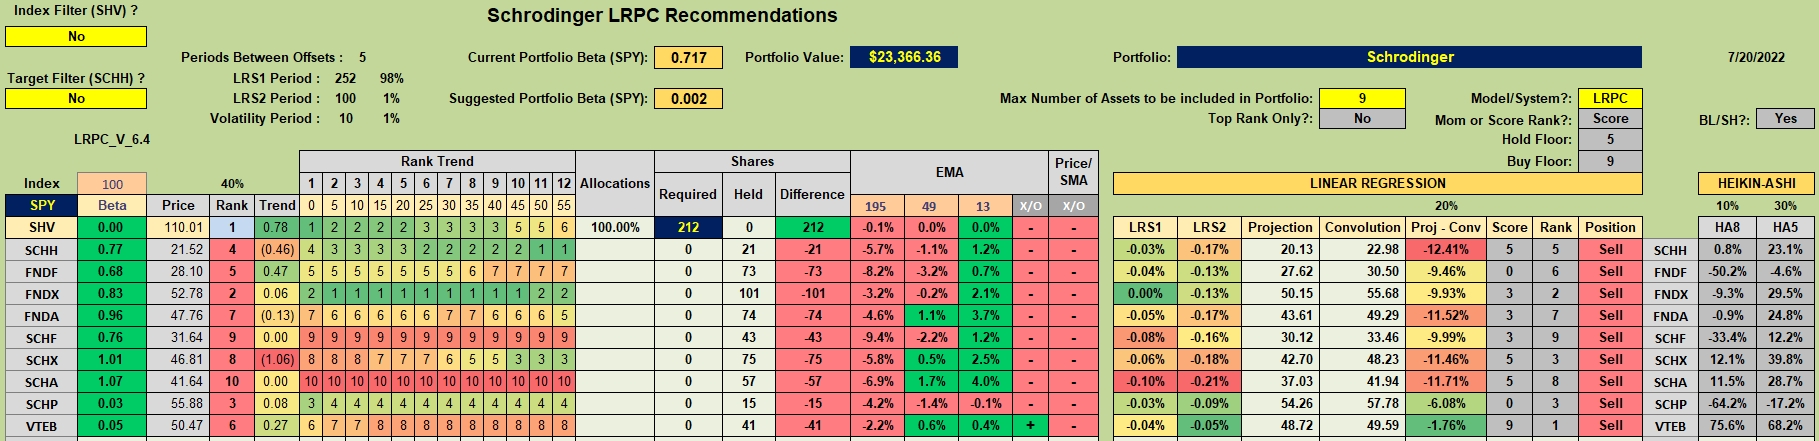
Below are the nine ETFs that make up the Schrodinger. The Target Filter is turned off as I don’t use the following worksheet to manage the Schrodinger. All one needs to do to run such a portfolio is open up an account with Schwab (or another firm running computer managed accounts), answer a few questions, invest the minimum amount of money, and specify the stock/bond ratio. By answering the questions Schwab will recommend a stock/bond ratio. You can change this later. As I recall, I made one adjustment in the last two or three years and I asked Schwab to concentrate the stocks in U.S. Equities rather than International Equities.
Your investment quiver will likely vary from the Schrodinger makeup depending on age and level of risk.
Looking at the Exponential Moving Averages (EMA values) one can see the recent market improvement as the shorter EMAs are green while the longer running EMAs are red.
Schrodinger Performance Data
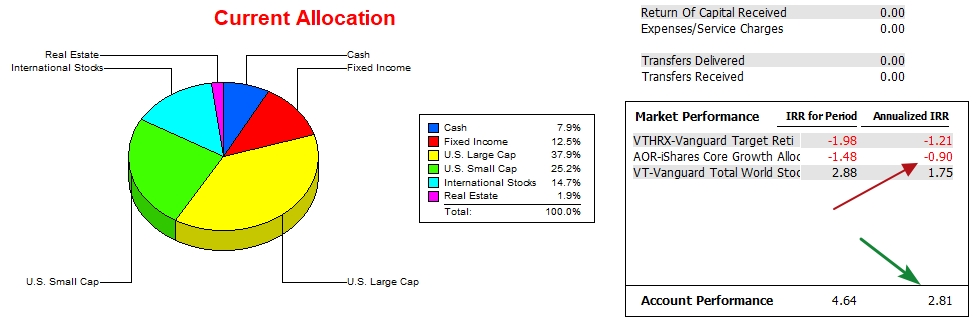
Since 11/30/2020 the Schrodinger has outperformed by the AOR and VT benchmarks.
Schrodinger Risk Ratios
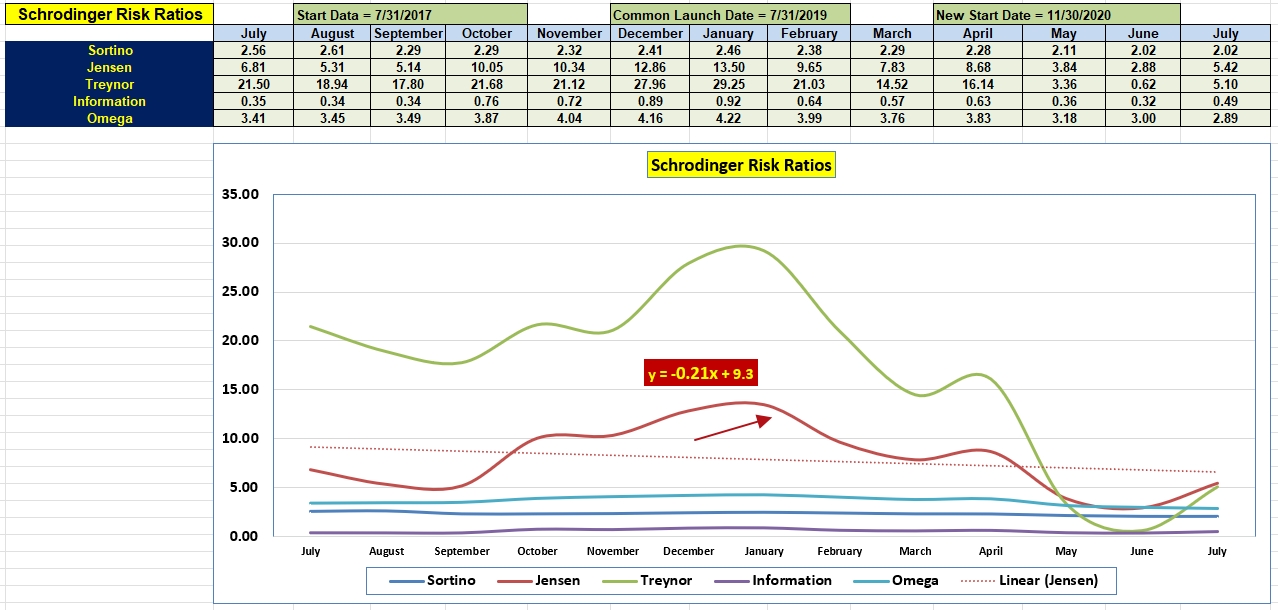
While the Jensen Alpha is still positive, the slope is negative due to the high performance levels during the fourth quarter of 2021.
Discover more from ITA Wealth Management
Subscribe to get the latest posts sent to your email.
Good morning Lowell. I hope you have time for two quick questions. (1) Regarding EMAs:
What is the definition of “X/Os” and of “X/O Price/SMA and how do they help you make
investment decisions? (2) What is the value of the Rank Trend Table. Thank you for your valuable work. John
John,
I’ll let Hedgehunter (David) explain the X/O question as he programmed that into the Kipling.
As for the Rank Trend Table, that information goes back to the Main Menu where one can set the Number of Offset Portfolios. I always leave this at 12. I also leave the Period Between Offsets at five (5). Again, you will find these settings in the upper left of the Menu worksheet.
With settings of 12 and 5, the Rank Trend Table goes into action. We are looking at price movements over different five business days going back 5 x 12 or 60 days. In other words, we are checking on price movements over five day periods. In the Schrodinger, FNDX has consistently ranked #1 or #2 over every five days for the past 12 tranches.
At the other end of the performance spectrum, SCHA continues to rest at the bottom when it comes to performance. It has not moves from the #10 position. As for Trend, dark green indicates the trend is up and dark red points to downward trend. Yellow is a stable trend.
Hope this helps.
Lowell
thx Lowell. Very helpful.
Hi here shrink :),
The X/O in the EMA section tells us whether the fast 13 EMA is above (+) or below (-) the Intermediate (49) EMA – of course these EMA lookbacks are defaults and can be changed if desired. Moving Average crossovers are popular/common methods for trend following/trading.
Similarly, the Price/SMA X/O tells us whether the current price is above or below the SMA (as set in the MENU sheet).- again a popular method of trend following/trading.
David