
Arches National Park
The Millikan portfolio is one of five Sector BPI experiments that have operated for nearly two years. While the results are positive, we need more data to show this unique investing model works well in all types of market environment.
Since the last update a shard share of the Financial sector was sold out of the portfolio. Otherwise no action is recommended among the sectors. When this is the case limit orders are set to pick up shares of VOO and VTI. If we were not so near to an uncertain election I would likely purchase the shares at market.
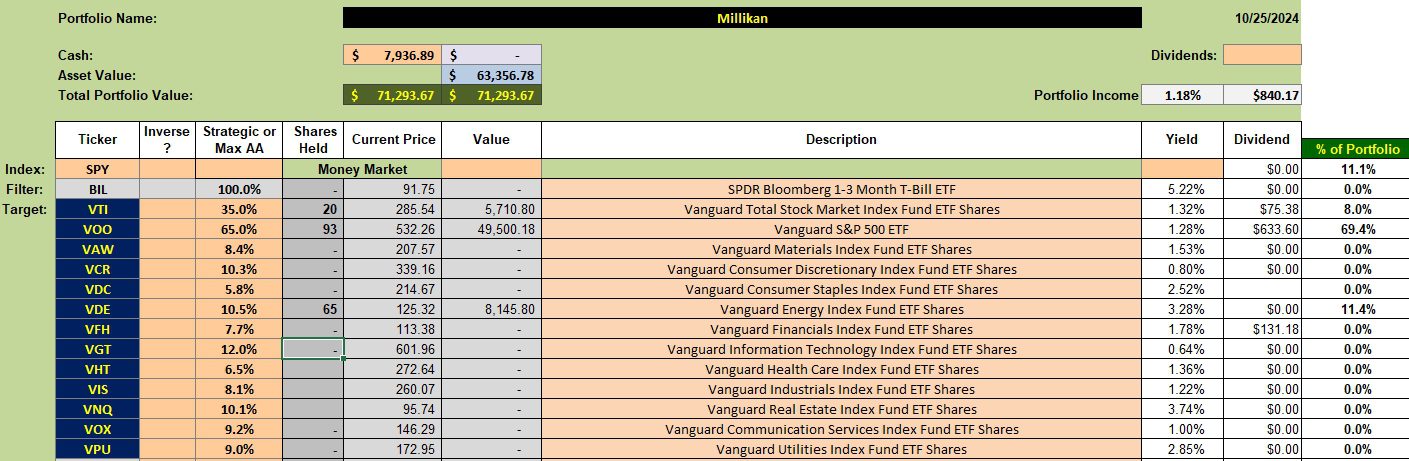
Millikan Security Holdings
Below are the current holdings in the Millikan. Energy will continue to occupy the portfolio until the sector reaches 70% bullish based on the Energy Point and Figure (PnF) graph.
I pull the Bullish Percent Indicator data off StockCharts. These graphs are known as Point and Figure graphs and are different than the normal price vs. date graphs.
Millikan Performance Data
Since 12/31/2021 the Millikan has outperformed the S&P 500 ETF, SPY by a small margin. The portfolio also outstripped the index by a wide margin as well as all the other potential benchmarks.

Millikan Risk Ratios
Of the four risk ratios I’m following, I pay most attention to the Jensen Alpha. The dip since September is likely due to holding 11% in cash. Cash is a drag on performance in a bull market.
Over the past year the Jensen slope is essentially flat. One goal is to turn the slope positive by early in 2025.

Millikan Sector BPI Portfolio Review: 10 May 2024
Millikan Sector BPI Portfolio Review: 6 September 2024
Discover more from ITA Wealth Management
Subscribe to get the latest posts sent to your email.
You must be logged in to post a comment.