
Old logging truck
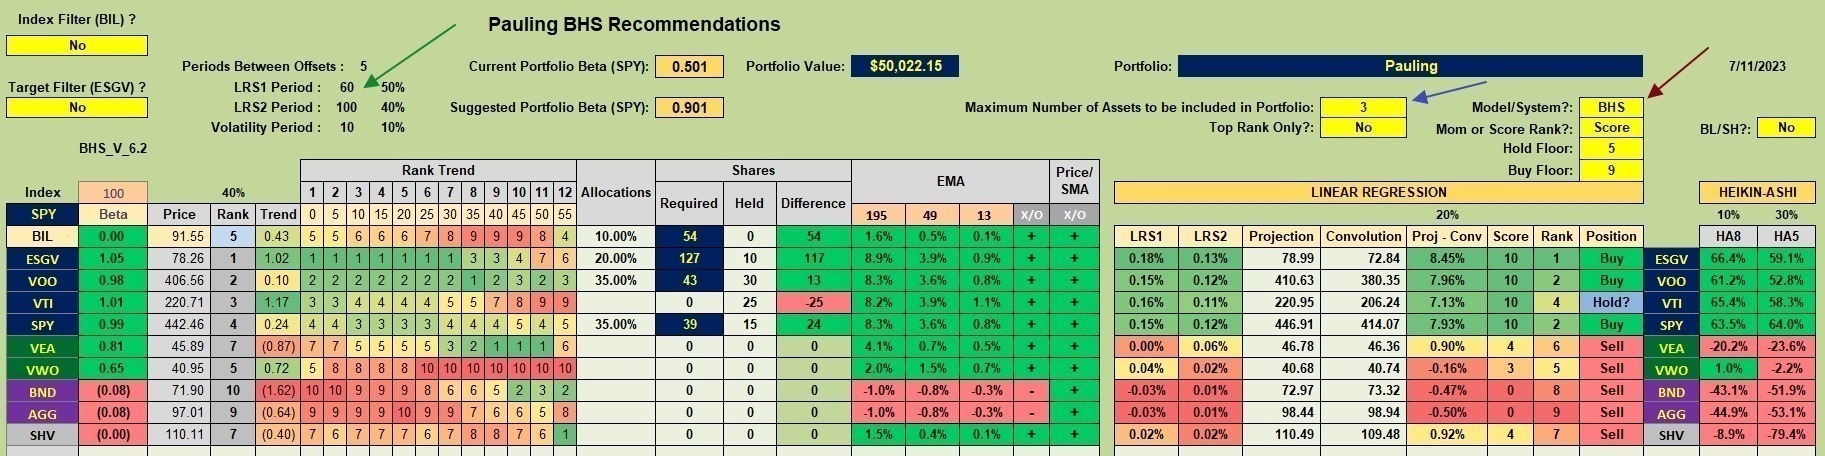
While the Pauling was not scheduled for review today, the large percentage of cash in the portfolio required some attention. This portfolio is either the poorest or next to the poorest performer of all the ITA portfolios. That is another reason to keep on top of this account. I’ve moved the investing model from the Dual Momentum™ approach over to what I call the Relative Strength model. This is not a major change, but should provide a tad more diversity as readers will see in a moment.
Pauling Security Recommendations
With the “new” Pauling I’m using the BHS model built into the Kipling spreadsheet. The investment quiver is limited to ten (10) different securities.
- U.S. Equities are: ESGV, VOO, VTI, and SPY. Yes, there is an abundance of overlap between these four ETFs.
- International Equities: VEA and VWO. These two ETFs cover both developed and emerging market equities.
- Bonds: BND, AGG, SHV, and BIL. SHV is a short-term treasury or what I think of an “off-ramp” for periods when nothing is going right in the equities space.
The current recommendation is to focus on U.S. Equities. First fill ESGV, then move on to VOO and SPY. I don’t worry about the overlap as the goal of the Pauling is to keep pace with the S&P 500.
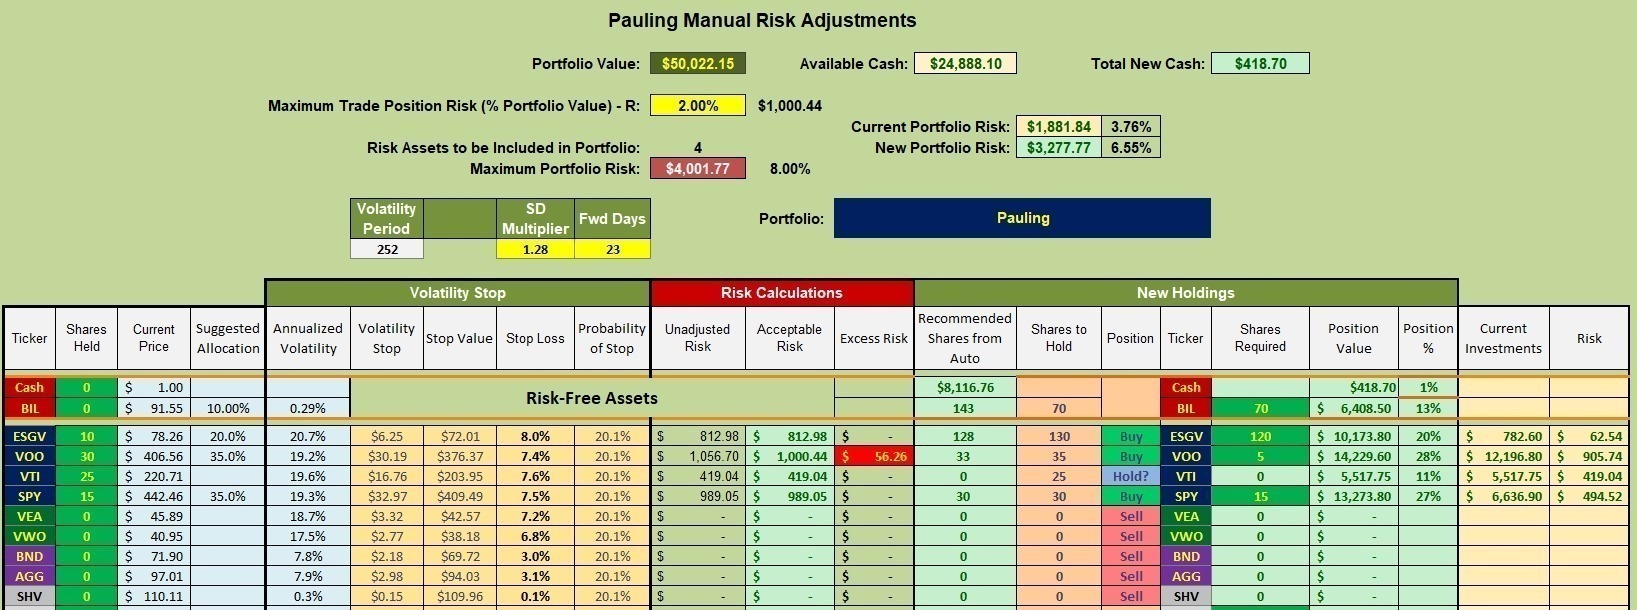
Pauling Manual Risk Adjustments
Within the Kipling spreadsheet is a worksheet that lies just before the one readers see below. Within that prior worksheet I set the SD Multiplier so the Stop Loss percentage is 8.0% for ESGV. I likely should adjust the SD Multiplier so VTI comes in at 8.0%. This is one of the risk controls used to manage the Pauling.
A second adjustment I using within that prior worksheet is to set the Maximum Trade Position Risk – R value. I have it set to 2.0% and that limited the Maximum Portfolio Risk to 6.0%. That 6.0% value changes to 8.0% in the visible worksheet below in part due to four assets are to be included in the portfolio instead of the original 3 specified in the above worksheet.
Note that I am filling ESGV, VOO, and SPY to the recommended shares and this leaves some cash. The Hold? recommendation for VTI leaves the decision up to the money manager. I am continuing to hold on to VTI. This means I can only purchase 70 shares of BIL instead of the recommended 143 shares.
Limit orders are in for the Shares Required (5th column from the right). One order was struck as I was writing this blog.
Pauling Performance Data
The annualized IRR for the Pauling is woefully behind the S&P 500 (SPY) benchmark. It will likely take months to make up this delta difference.

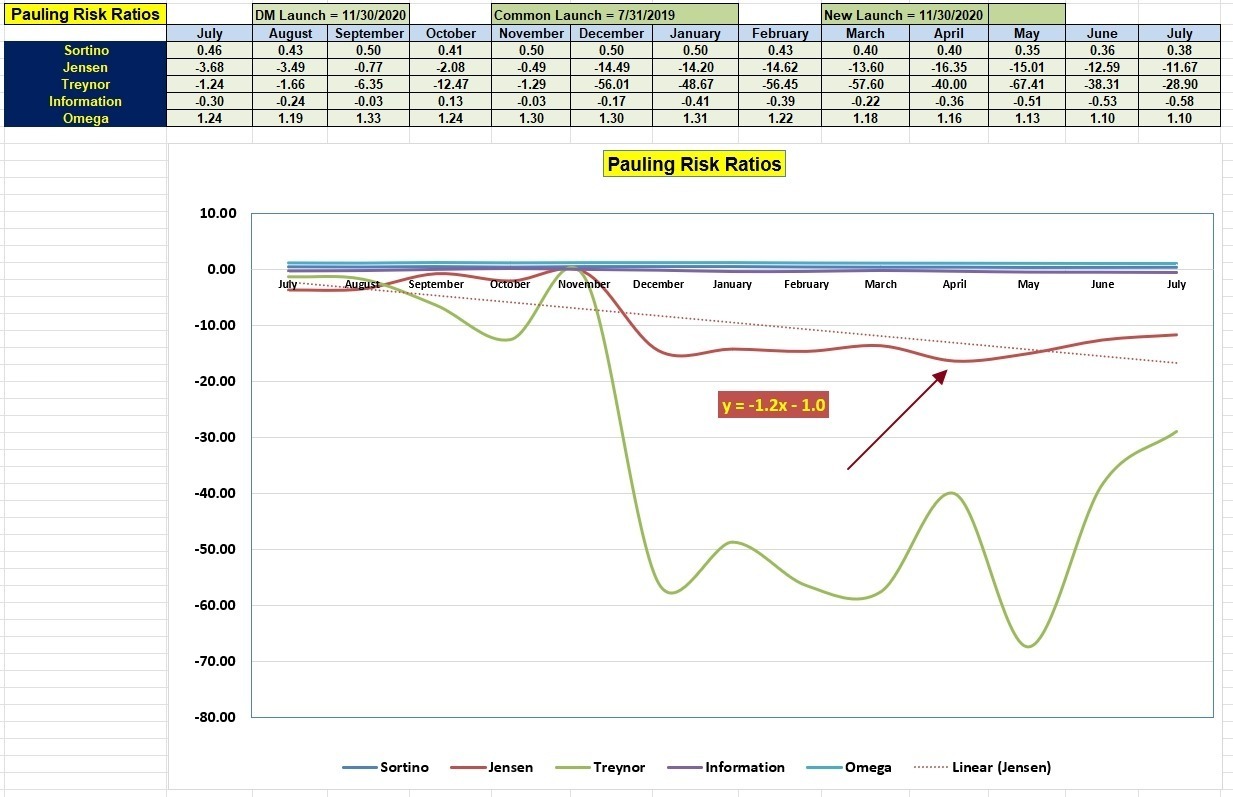
Pauling Risk Ratios
The following five risk ratios will provide a clearer view as to how well the new investing model performs. Checking on the Jensen Performance Index we see improvement since April of 2023. If we have a flat stock market over the next several months we should see a positive Jensen slope.
Of concern is the Information Ratio as that value most clearly measures how well the portfolio is performing with respect to its benchmark and it is declining.
https://seekingalpha.com/article/4616279-sector-bpi-investing-a-contrary-investing-model
Discover more from ITA Wealth Management
Subscribe to get the latest posts sent to your email.
You must be logged in to post a comment.