
Geese – Skating on Thin Ice
First, a look at the performance of US Equities over the past week shows that the initial weakness seen at the Open on Monday quickly turned around to see US Equities finish the week ~ 3% higher than last week’s close:
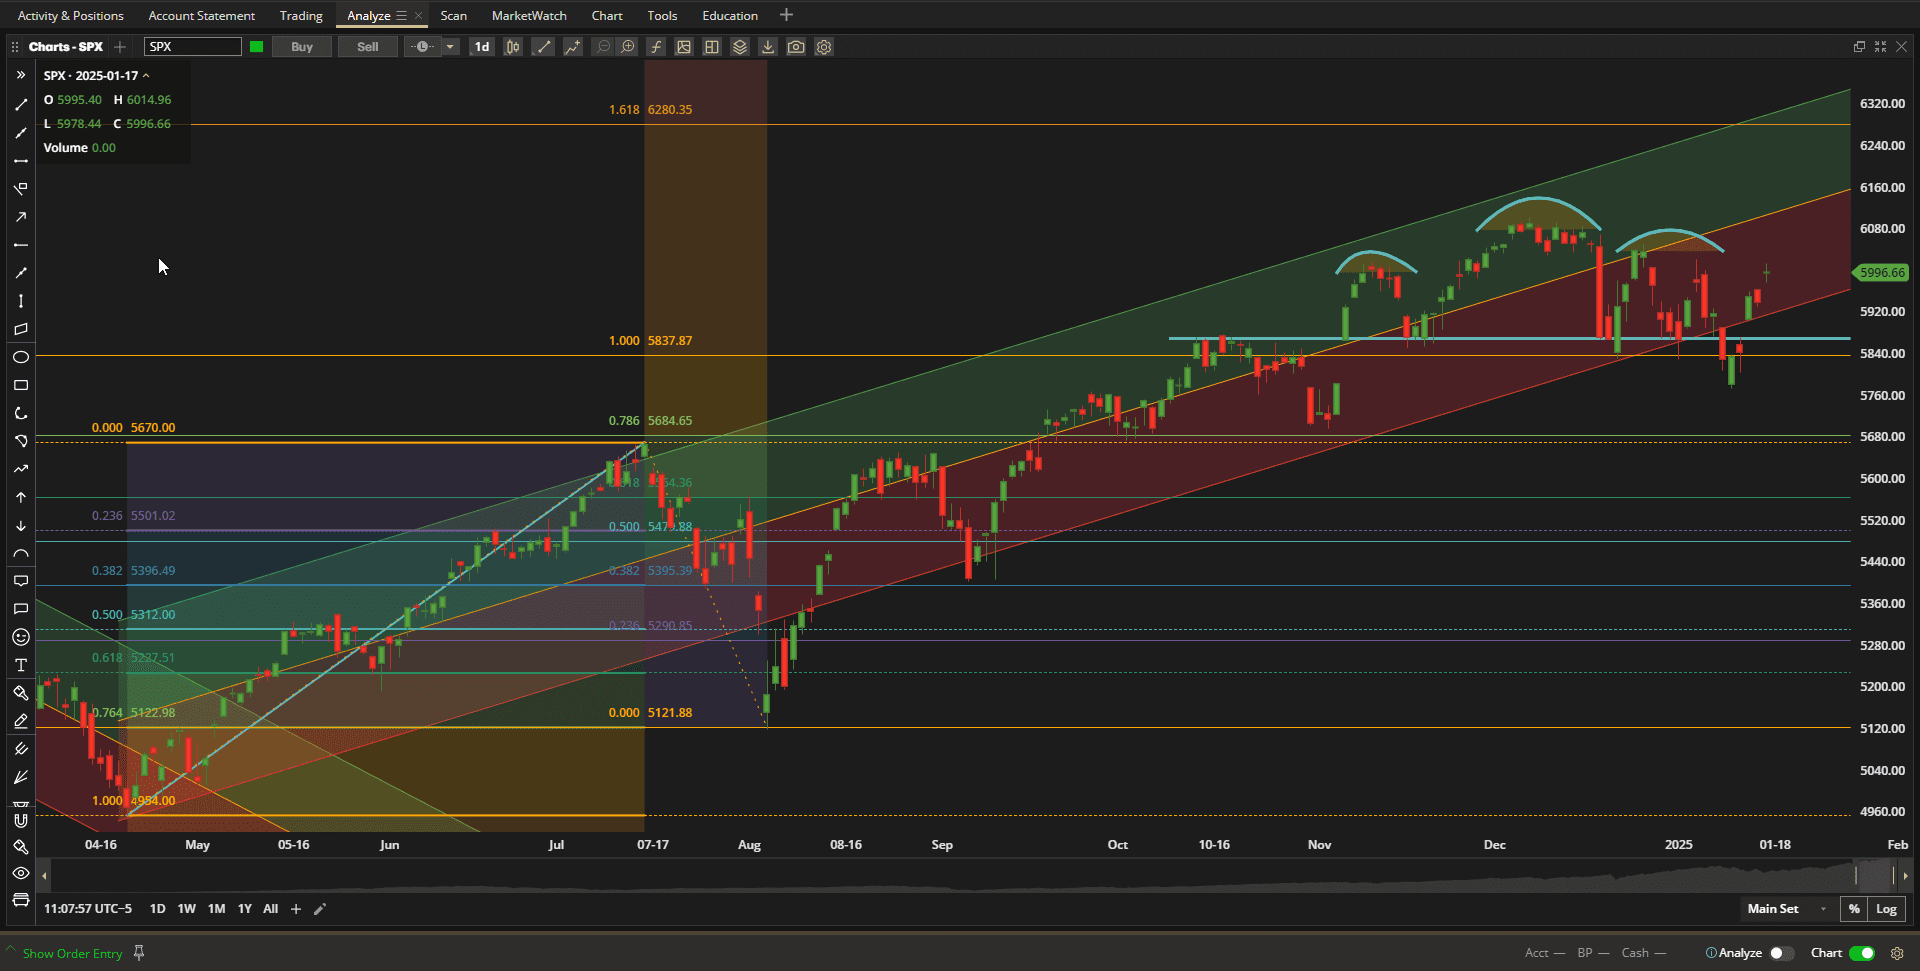 After dropping out of the uptrend channel last week we are now back well within the channel boundaries.
All asset classes showed strength, with positive returns over the past week, led by the Cryptocurrency ETF, IBIT:

The Rutherford-Darwin Portfolio started out with $70,000, of which ~$50,000 was invested in BIL (T-Bills) as a “risk-free” component of the portfolio that needs no management and limits total portfolio risk and Draw-Down to less than 30%. Since inception this portion of the portfolio has picked up a few dollars ($85) in profits.
The second, and most straightforward portion of the portfolio (Darwin) is essentially a ~$10,000 “Buy-And-Hold” portfolio that is invested in nine (9) assets through the direct purchase of shares in each ETF in the investment quiver:
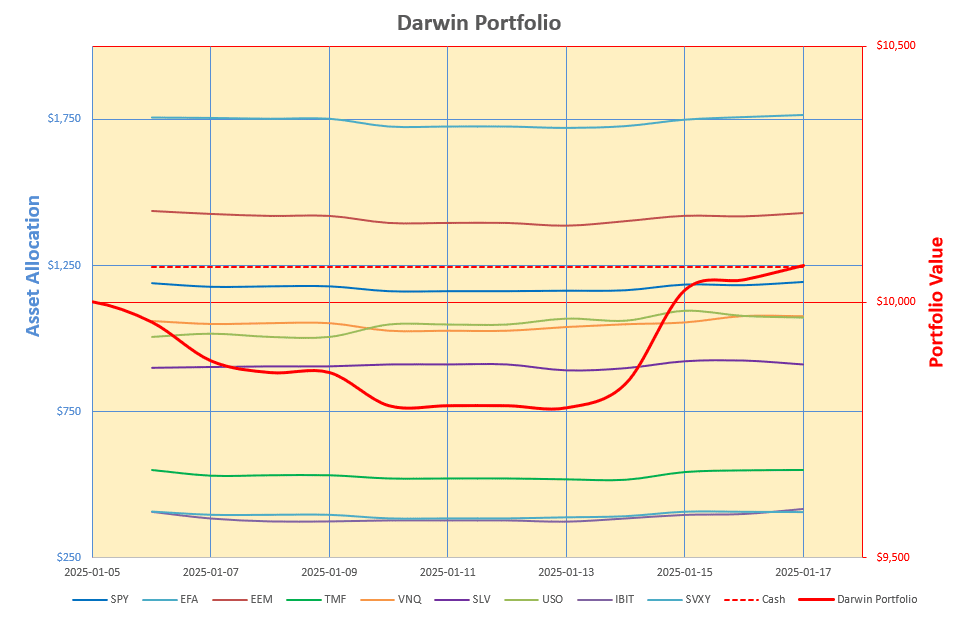 This is a portfolio of diverse holdings. covering assets in just about all major asset classes. with funds allocated based on Risk Parity and Volatility targets. As we can see (heavy red line) this portion of the portfolio recovered nicely from the drop that we saw in the first week of the year and is now showing a small (~$70) profit since inception. This translates to an annualized 15.43% Internal Rate of Return – but, of course, this doesn’t mean too much after only 2 weeks:
 Moving to the active portion of the portfoli0, this uses the remaining ~$10,000 to invest in Options (Calls for bullish positions and Puts for bearish positions) in some or all of the same ETFs held in the Darwin portion of the portfolio. Over the first 2 weeks I have been populating this portion of the portfolio and am now invested in all assets within the “quiver”. It is not my intention to be fully invested in this portion but I wanted to make sure that I could do so, if required, within the $10,000 budget.
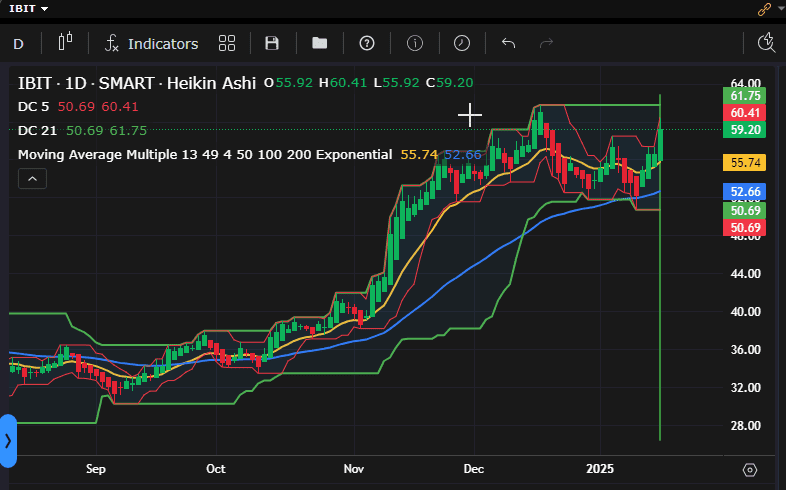
I have updated previous posts to notify readers when I have added new positions – except for the last addition, that was a bullish position in IBIT that was added on Friday as I saw a potential breakout to the upside after a recent pullback in prices:
 The Profit/Loss Risk Graph looks like this:
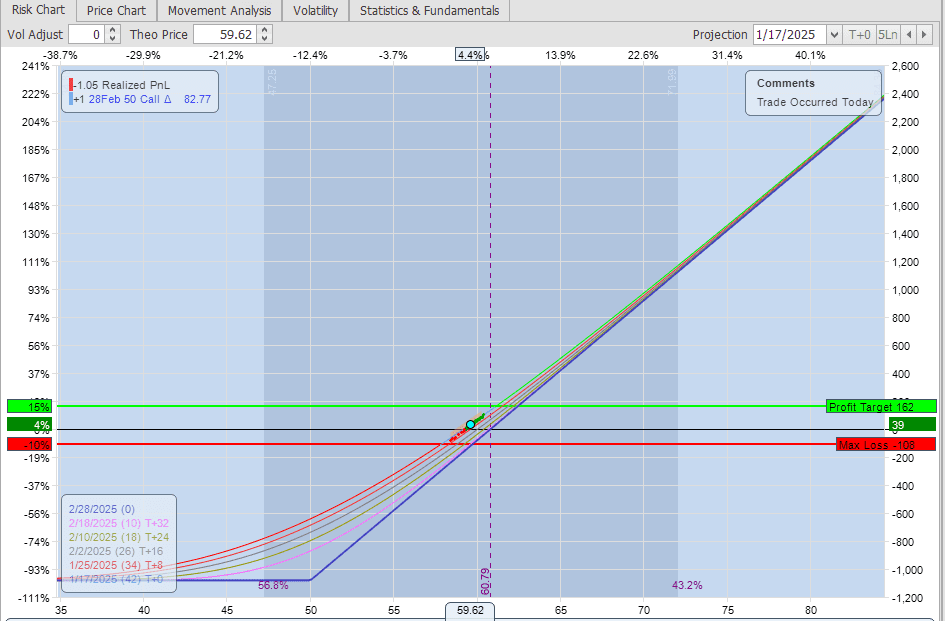 with a “Delta” of ~0.82 – or equivalent to holding 82 shares. The Option is at the $50 Strike Price and expires 28 February (42 days). Because of high volatility in this ETF (>60%) the Options are expensive so this position needs an upside move of ~3% to break even at expiration.
Current positions in this portion of the portfolio look like this:
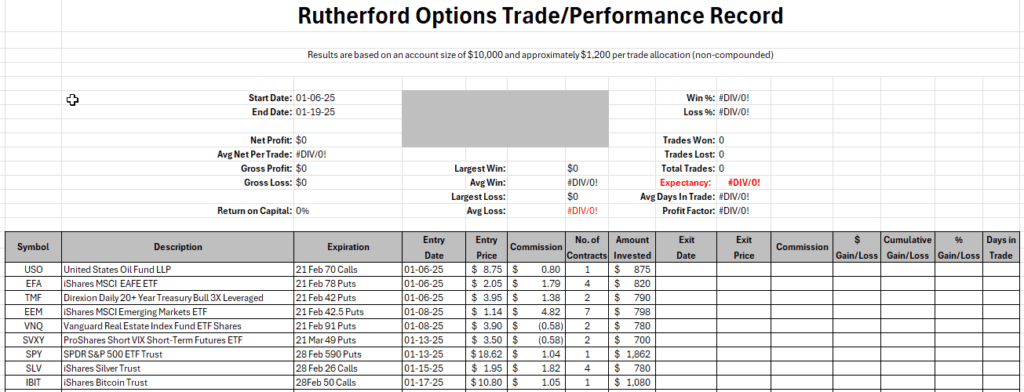 and performance to date looks like this:
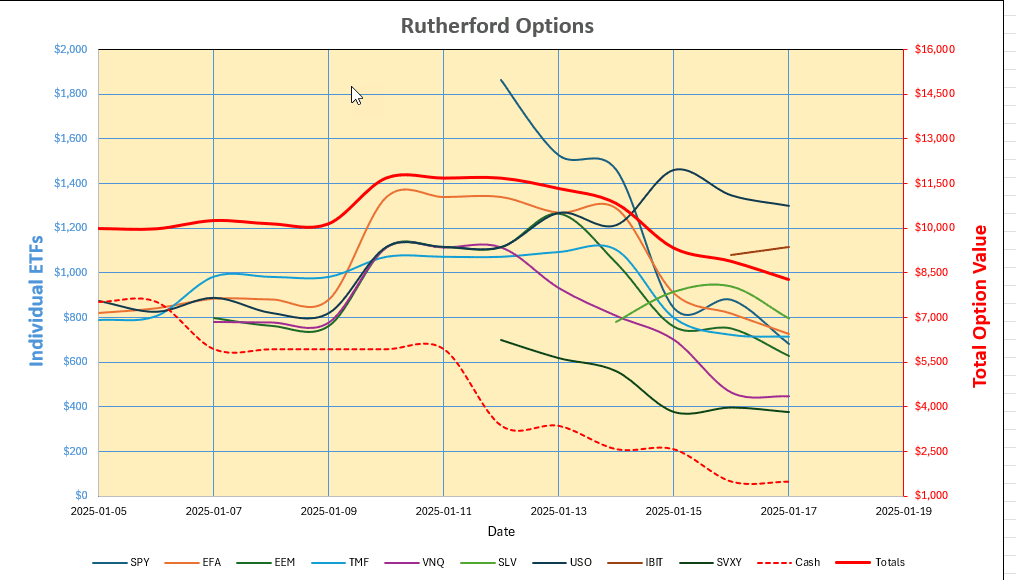 A little more action here (as I had warned) with last week’s ~12% gains (~$1,200) being reversed and the portfolio now showing a ~12% loss (heavy red line – right hand axis). The big loser here was my short position in SPY (US Equities). I mentioned last week that I was not totally comfortable with this position due to the higher relative risk (2x other holdings) – the Option is also closer to ATM (At-The-Money) than other Options in the portfolio and therefore demands a higher premium. I will be watching this one closely next week – and if the bullish trend continues I will be selling the bearish position.
This looks a little scary – and it is – but, remember that this is less than 10% of the total portfolio – so total portfolio risk from this portion is presently still only ~1%.
Putting everything together the total portfolio looks like this:
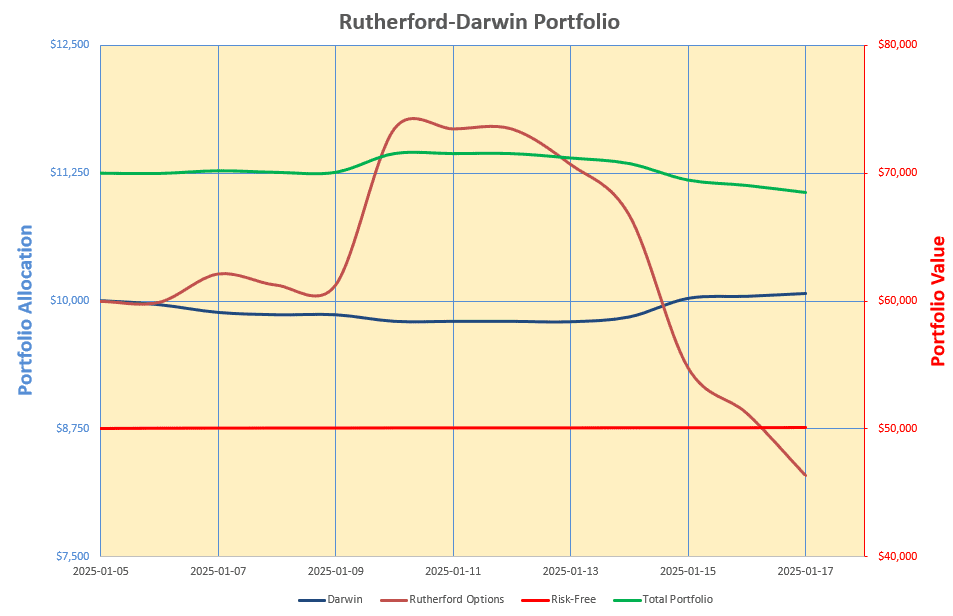 where we clearly see the difference in volatility and risk in the 2 smaller (more active) portions of the portfolio (blue and brown lines – left-hand axis) but the relatively calm (more “normal”) behaviour of the total portfolio (heavy green line – right hand axis). The “risk-free” portion (red line – right-hand axis) is obviously very boring.
As mentioned above, I purposely fully populated the Options portion of the portfolio in order to check that I could do so within the $10,000 limit. Going forward, this will likely not be the case and there will be times when I do not hold a position in certain ETFs. The first example of this will probably be next week if I decide to close the bearish position in SPY and go “neutral”. Other positions that I might, normally, be “neutral” on are EEM (still bullish longer term), VNQ (still bullish longer term) and SLV (still a little bearish mid term – but testing a near-term bullish entry for effectiveness). Because of the ~1 month nature of the Options that I am holding I am still trying to decide the best time-frames to be watching and on which to “trigger” a position. I am monitoring Daily, Weekly and Monthly Charts.
At the present time I have ~$7,000 in Cash – so I will probably buy an additional 75 shares in BIT to generate a little more “income”. I am holding these positions in a Margin account so I don’t have to worry too much about exceeding the $70,000 limit – other than to check occassionally that I am not “leveraged” and paying interest.
Update: 21 January 25
With markets everywhere seeming to respond positively to President Trump’s statements yesterday, I have made a number of adjustments to the Rutherford Options portion of the portfolio. I have closed out my bearish positions in SPY (US Equities), EFA (International Developed Market Equities) and SVXY (Inverse Volatility ETF. As you will be aware, if you have been following these posts, I wasn’t too comfortable with the size/risk in the SPY position anyway and I have replaced SPY with SPLG – an ETF following the S&P 500 Large Caps, and have bought Calls, switching to Bullish on US equities. I bought 3 contracts of the $68 Strike Call Options expiring 21 February at 3.35 ($1,005) bringing my position risk more in line with the other positions held in the portfolio. I considered only buying 2 contracts but, since I am still bearish on EEM (International Emerging Market Equities), I decided to go with 3 contracts. By switching to SPLG I was also able to go further In-The-Money (ITM) with a higher “Delta” and lower extrinsic time premium. I considered switching to SPYG (S&P 500 Growth tracking ETF) but SPLG trades at a slightly lower price and probably doesn’t behave too much differently. The only downside of the switch is that it doesn’t offer weekly expiring Options (only Monthlies) and is less liquid (less Open Interest), with wider Bid-Ask spreads – so it will need more patience to trade.
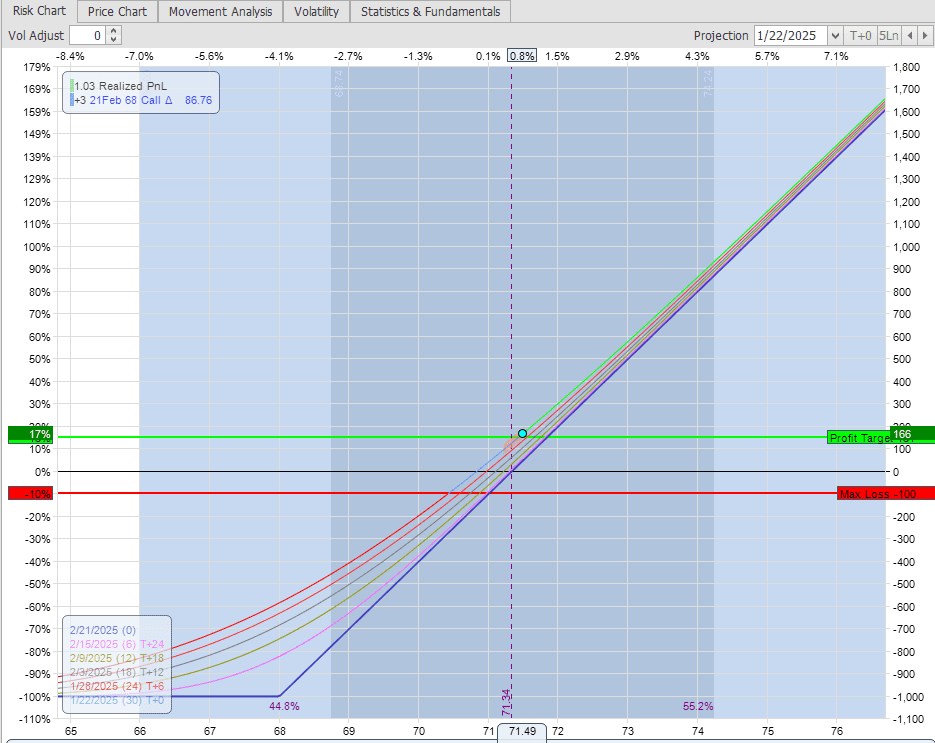
I have no current positions in EFA or SVXY – which is what I am anticipating going forward – i.e. not having positions in all 9 ETFs. I may back out of a couple more of the positions later in the week since I am more neutral than bullish or bearish on them – but we’ll wait to see what the follow-up is like over the next few days.
Discover more from ITA Wealth Management
Subscribe to get the latest posts sent to your email.
Hi,I’m very interested
Thanks William,
Just fire out any questions that you might have – always pleased to answer them.
I’ve just added a short update to the post after Monday’s inauguration. More details at the end of the week as we see where we might be going.
David