
Gretna Green, Scotland
After making a mandatory ~$20,000 withdrawal from the Rutherford Portfolio, that I had been managing using a strict momentum model, I was left with ~$70,000 for future investment. Going forward into 2025, and beyond, I plan to split these funds into 3 portions.
In Part 1 of this series (https://itawealth.com/rutherford-portfolio-review-part-1-3-january-2025/), I outlined how I plan to allocate the first portion of the funds (nominally ~$10,000) to a portfolio that follows the strategy and management style previously used to manage the Darwin Portfolio. This means that it will be a diversified portfolio of nine (9) ETFs – an increase from the original five (5) ETFs selected for the Darwin Portfolio) – representing most major asset classes – with a couple that may not yet be widely recognized as asset “classes” – SVXY (Volatility) and IBIT (Cryptocurrency). However, this is a relatively simple portfolio to manage since funds are allocated to all 9 ETFs and there will otherwise be little adjustment unless the allocations get seriously out of balance – i.e. it will be close to a Buy-And-Hold portfolio.
In an attempt to demonstrate how the same 9 ETFs might be managed using a totally different system I will allocate another nominal ~$10,000 to using Options as the investment vehicle. At this point it becomes questionable as to whether this might be considered an “investment” portfolio or a “trading” portfolio. However, since I will be choosing Options with an expiry date of more than 30 days I will choose to label it as an “investment” portfolio since the hope might be that it will not need significant adjustments within a monthly timeframe – our “normal” review frequency (although I will likely be monitoring it more closely – at least initially). Nevertheless, by it’s nature, it will be a much more actively managed portion of the portfolio.
Since Options are a leveraged product, the first thing that we can expect is that volatility (and risk) will be significantly higher than for the Darwin portion of the portfolio. In order to control/manage the risk of the total portfolio I will therefore keep the remaining ~$50,000 in a “risk-free” asset – at this point in time, with short-term treasuries paying ~5% yield, this will be BIL, the T-Bill ETF. Thus, in terms of overall portfolio risk management I will only have ~$20,000 of the $70,000 “at risk” – less than 30%. At some point in time – in the future – I may increase the risk exposure – but I want to see how this works out before doing that. This is always a prudent approach when opening a new portfolio using new management principles – to start small.
Options
I don’t want this to be a complex or technical explanation of Options – I want to keep it as simple as possible so that the reader’s eyes don’t glaze over after a couple of paragraphs. If I make it seem too simple and you require more information just ask questions in the comment section.
There are only 2 types of Options – Call Options and Put Options.
Simple 1
- If we are Bullish we can buy Call Options
- If we are Bearish we can buy Put Options
Note that I will only be looking at the ownership/purchase or being “long” Options. Options can be bought or sold – but selling Options (except to Close an Open position) is a more complex world and I would like to keep things simple.
What is an Option?
When we buy an Option we have the right (but not the obligation) to exercise that Option in exchange for ownership of the underlying security. In this portfolio it will not be our intention to own the underlying security (unless we change our strategy) so we will never own the underlying stock/ETF – we will exit our positions by simply selling the Option that we own – exactly as we do for stock/ETFs.
For the sake of completeness – although it won’t apply to us – the seller of Options has the obligation to deliver the underlying security if the buyer chooses to exercise his/her Option.
Where it becomes a little more complicated is because there are tens, sometimes hundreds, of possible Options to choose from for any particular underlying security. These differ, primarily, from the different expiration dates and different “strike” prices (price at which the Option can be exercised).
I won’t get into the details of how Options are priced except to say that there are two components of the price we pay when buying – there is an “intrinsic” value to the Option – the amount by which the Option is In-The-Money (ITM) – or the difference between the current price of the underlying asset and the strike price of the Option. For example, a Call Option with a strike price of $90 when the stock/ETF is trading at $100 will have an “intrinsic” or “real” value of $10 ($100-$90) since the Option can be exercised for $90 when the underlying is at $100 – thus showing $10 profit (less the cost of buying the Option). This is what gives us the leverage inherent in Options. There is also an “extrinsic” or “premium” component of the Option price that is dependent on time to expiration of the Option (longer time to expiration demands higher premium) and volatility of the underlying asset (higher volatility demands higher premium).
I don’t want to complicate things further so we’ll move on to some specific applications and take a look at what this means.
Which Option to Buy?
As outlined above, Options Price is determined (primarily) by strike price, time to expiry and volatility of the underlying asset. So, we need to establish our objectives when selecting which Options to Buy.
Simple 2
Ideally, I want the Option that I am buying to act very similar to the stock/ETF that it represents without the “premium” being so high that it presents an insurmountable hurdle to generating a profit. Because I know that Options with longer expirations are more expensive (have more “extrinsic” time premium) I need to keep the time to expiration reasonable.
These rules/guidelines are by no means rigid but, for this portfolio I will:
- look for Options with ~45 days to expiration (+/- 1 week either way);
- Select a strike that behaves as close to the underlying asset as possible;
- look for Options with a premium of less than 1% of the price of the underlying security
It can be difficult to satisfy all these conditions/rules so let’s look at some real examples.
First of all, let’s look at USO – our Oil ETF in the portfolio:
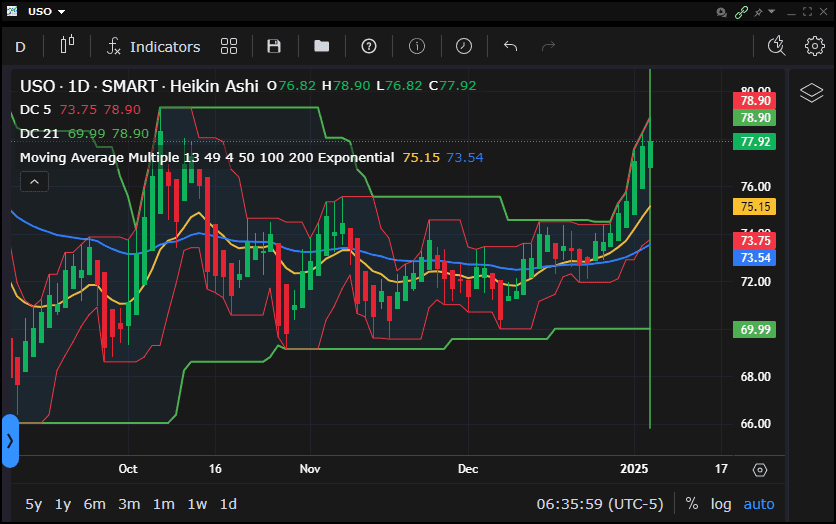
I am bullish on this ETF as it has recently broken out of a consolidation range – so I want to buy Calls.
Looking at the “Option Chain” for USO Calls I first select the 21 February expiration date (blue circle) – 46 days to expiration.
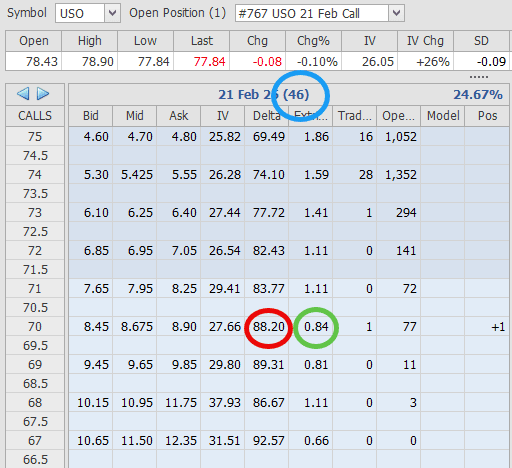
I then check how closely the Option will track the underlying – and see a “Delta” of 88.2 (red circle) for the $70 Call Options. This means that the value of the Option will move ~$0.88 for every $1 move in USO – pretty good. Alternatively (another way of looking at it), it means that by holding this Option, I am holding the equivalent of 88 shares in USO. From this Option Chain I see that the Option is Bid at $8.45 and Ask is at $8.90. Since 1 contract controls 100 shares of the underlying asset my cost will therefore be somewhere between $845 and $890 to get into this position. My actual fill price (using limit orders) was 8.75 or $875. The final check is the “extrinsic” value in the Option which, in this example, is $0.84 – or slightly more than 1% of the current share price ($77.84). This means that I need price to move up 1% to break-even on the position.
So, for an $875 investment I am holding the equivalent of 88 shares of USO. Compare that with my $1,022 investment in the Darwin portion of the portfolio that only bought me 13 shares. Roughly 8:1 leverage. For roughly the same risk I have the potential to make eight times as much money. The 13 shares in the Darwin portion have unlimited downside risk so I have to manage the number of shares to hold in the portfolio to control my risk. My downside risk on the Call Option is capped at what I paid for it – and is equivalent to holding 88 shares. Of course, this is only good for 46 days, so I need to see some positive price movement in this time frame before starting all over again.
Here’s what the Profit/Loss Risk Graph looks like:
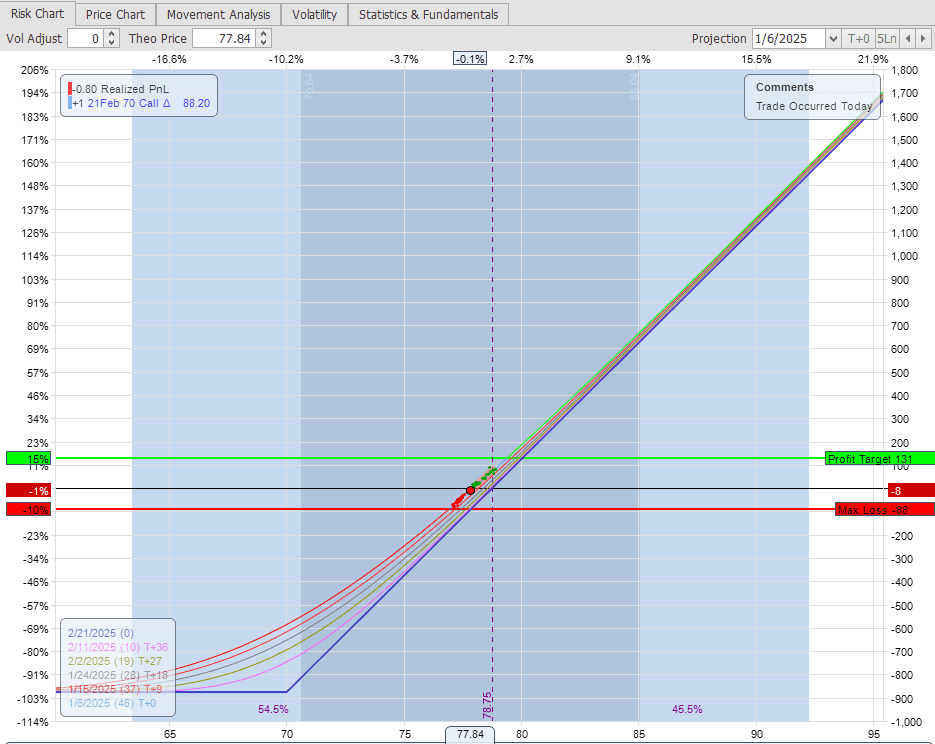
with unlimited upside potential and maximum $875 loss to the downside. I won’t get into exit strategies/rules here, but I would definitely be selling this (to Close) if price got down to $70.- so my loss would be less than $875 – likely less than ~$650. Of course, my loss on the 13 shares held in the Darwin portfolio, if price dropped to $70, would only be $113 – the benefits and risks of the 8:1 leverage.
Now let’s take a look at the other side of the coin when I’m nervous about being long and I’m more bearish on the asset. Here’s the chart of EFA (Developed Market Equities) yesterday:
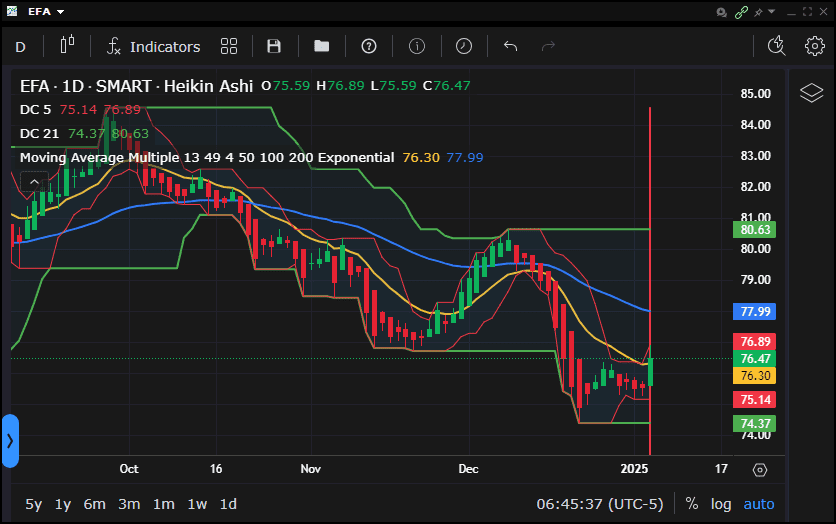 and I see that we are in a downtrend channel and have recently broken lower out of a sideways consolidation range – so I am bearish on EFA.
Again, we’ll take a look at the Option Chain – this time for Put Options:
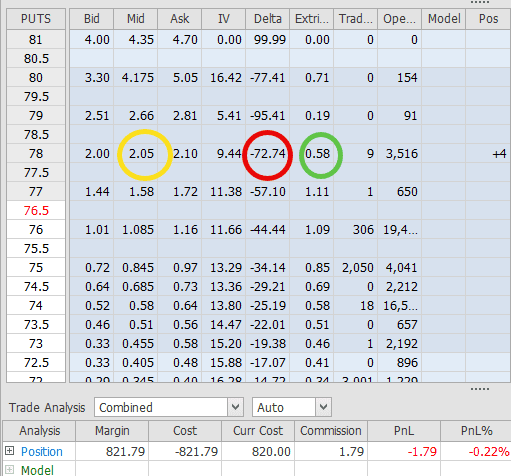
Where we see that the $78 strike Put Options are Bid at $2.00 and Ask at $2.10. On this position I was filled at the mid price ($2.05) on four contracts for a cost of $820. This is again determined by my desire to keep maximum risk below $1,000.
The “Delta” on these Puts is -72.74 (negative because they are Puts and Bearish), slightly less than for the USO Calls. However, with four contracts this is equivalent to Selling 4 x 72.74 = ~290 shares of EFA. The extrinsic value in these Options is 0.58 (green circle) or less than 1% of the current EFA price ($76.53).
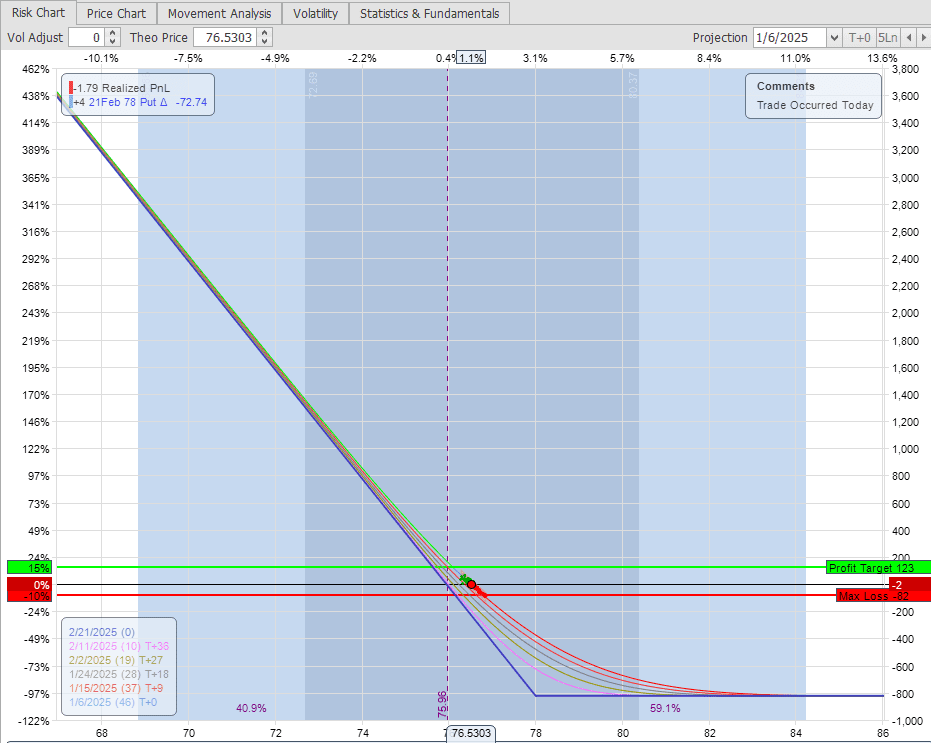
The Profit/Loss Risk Graph for this position looks like this:
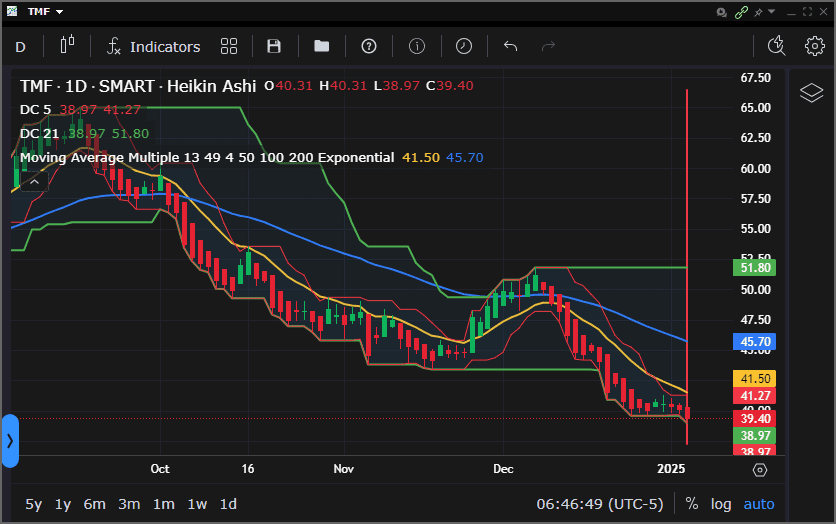
Finally, the other ETF that I favor short rather than long is TMF, the 3X leveraged Bond ETF:
Again, the Option Chain for 21 February Put Options in TMF:
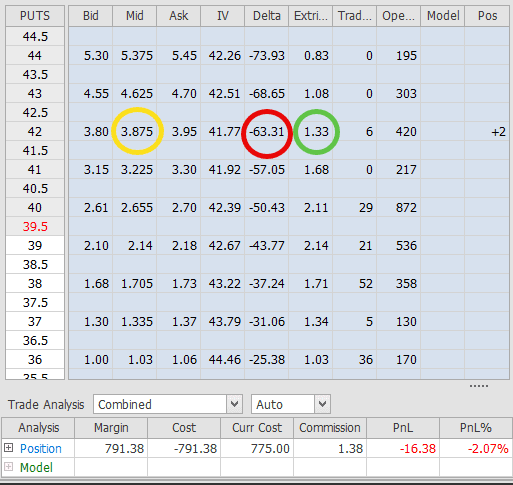
shows the February 21 $42 strike Put Options selling for $3.95 (actual fill price). These are relatively expensive Options due to the high volatility of this 3X leveraged product – so the best I can really do here is to buy 2 Options with a “Delta” of -63.31 for an equivalent position of being short ~127 shares. The extrinsic value in these Options ($1.33) is also well ahead of the 1% value of the shares that are selling at $39.45 – so I will need a 3+% move to break even. I’m not totally happy with this – but we’ll see how it goes – this is the first time that I’ve played with Options on a 3X leveraged product.
The Profit/Loss Risk graph looks like this:
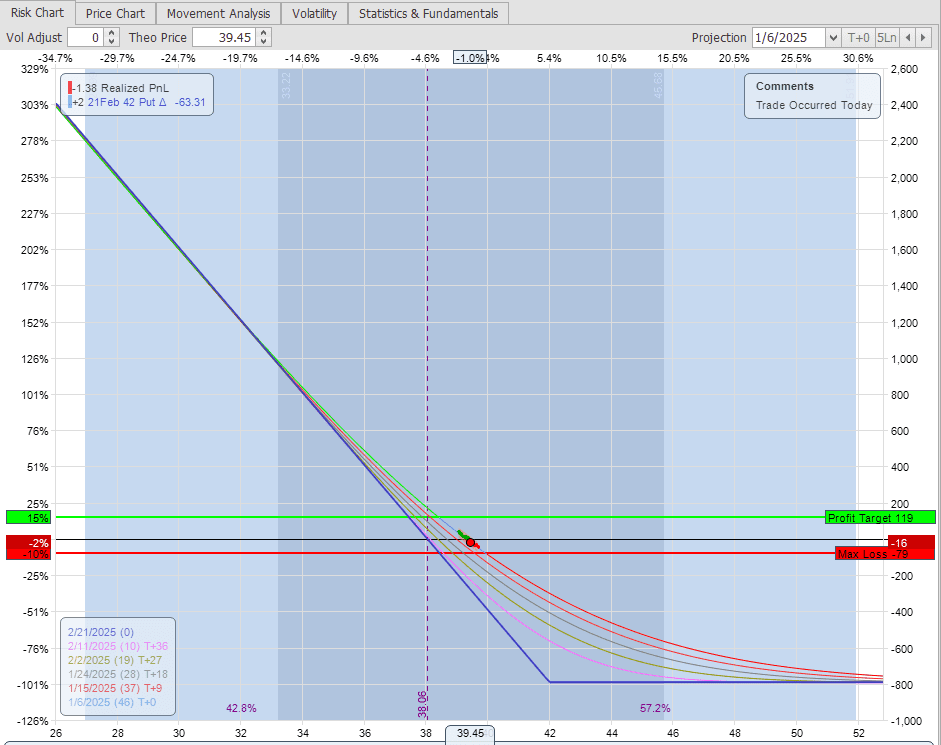
with a break-even at $38. But this ETF moves – in fact it’s sitting at $38 right now – 1 day later – with a profit at this point of ~$185.
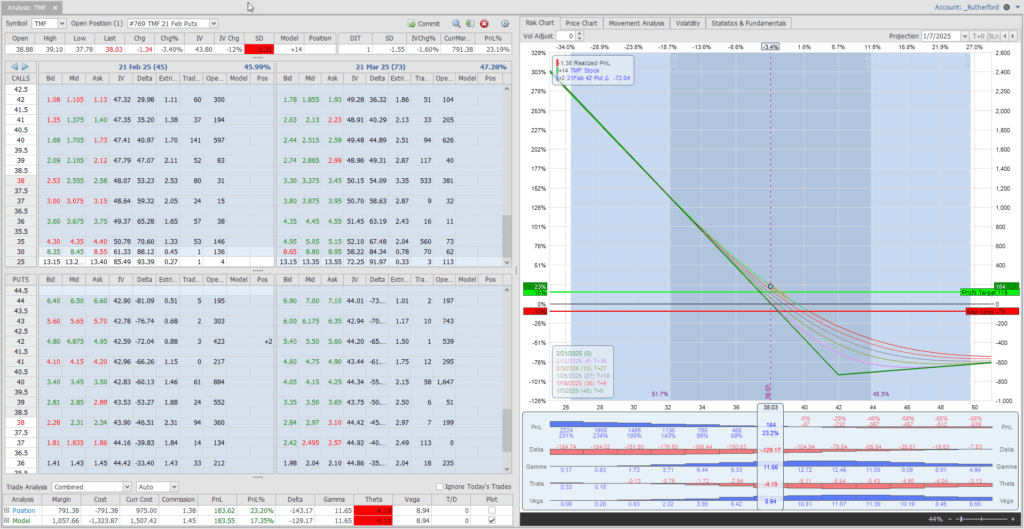
Just for interest, the following shows the Profit/Loss picture for the combination of positions in the total portfolio (including the 14 shares held in the Darwin portion). The position is hedged – in fact over-hedged – with a bias to the downside. I am comfortable with this with a maximum loss of only ~$800.
Here is a screenshot of the current positions:
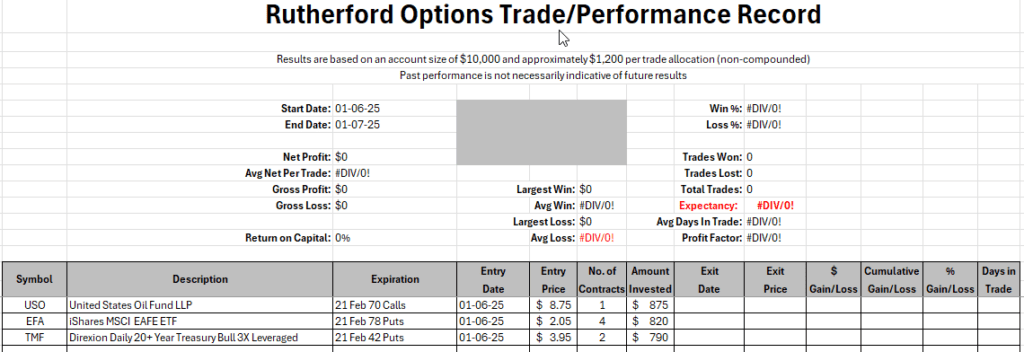
I will update this post as I add new trades to this portion of the portfolio. The plan is not to be totally invested in all assets at any particular time – but to add/delete Option positions as deemed necessary based on market action.
Anyone who is still awake and would like more explanation please ask your questions in the comment section below and I will be pleased to answer.
Update 7 January 2025
Reviewing the charts for the nine (9) ETFs in the Rutherford-Darwin Portfolio I have gone bearish on two more – EEM (Emerging Market Equities) and VNQ (US Real Estate.
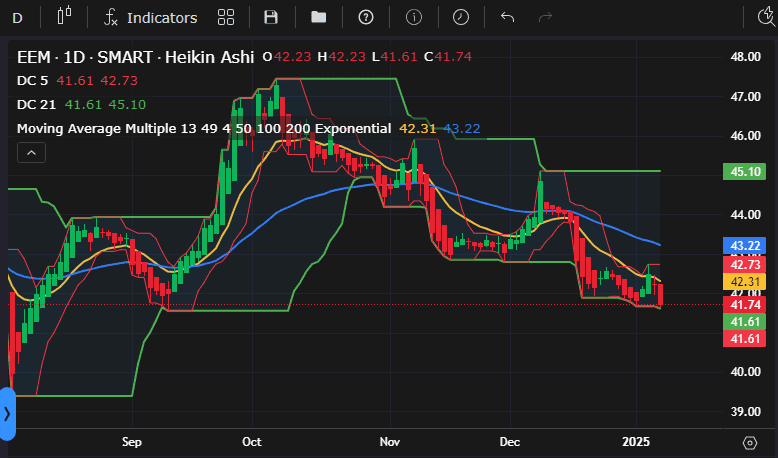
EEM has broken down outside it’s bearish channel so I have bought 7 Put Options at the $42.50 strike expiring 21 February (44 days) at 1.14 ($798). These Options have a Delta of ~ -0.61, so this is equivalent to being short ~430 shares of EEM.
The Profit/Loss Risk Graph looks like this:
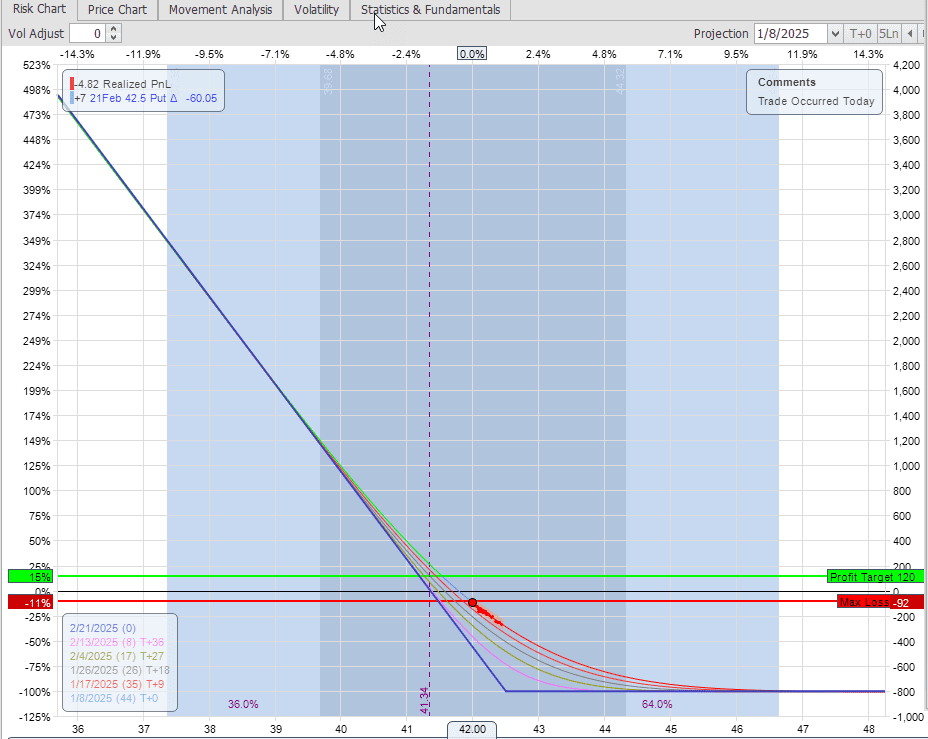
With $798 maximum risk.
VNQ is also looking weak:
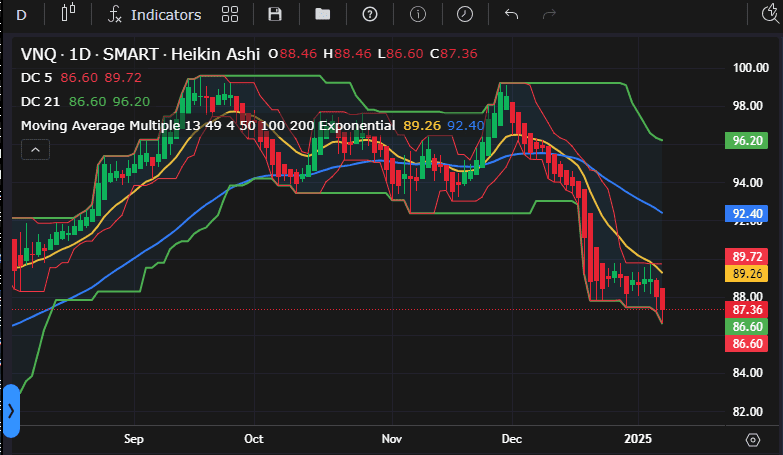
So, I have bought 2 Put Options at the $91 strike expiring 21 February (44 days) at 3.90 ($780). These Options have a Delta of ~ -0.77 so are equivalent to being short ~155 shares of VNQ.
The Profit/Loss Risk Graph looks like this:
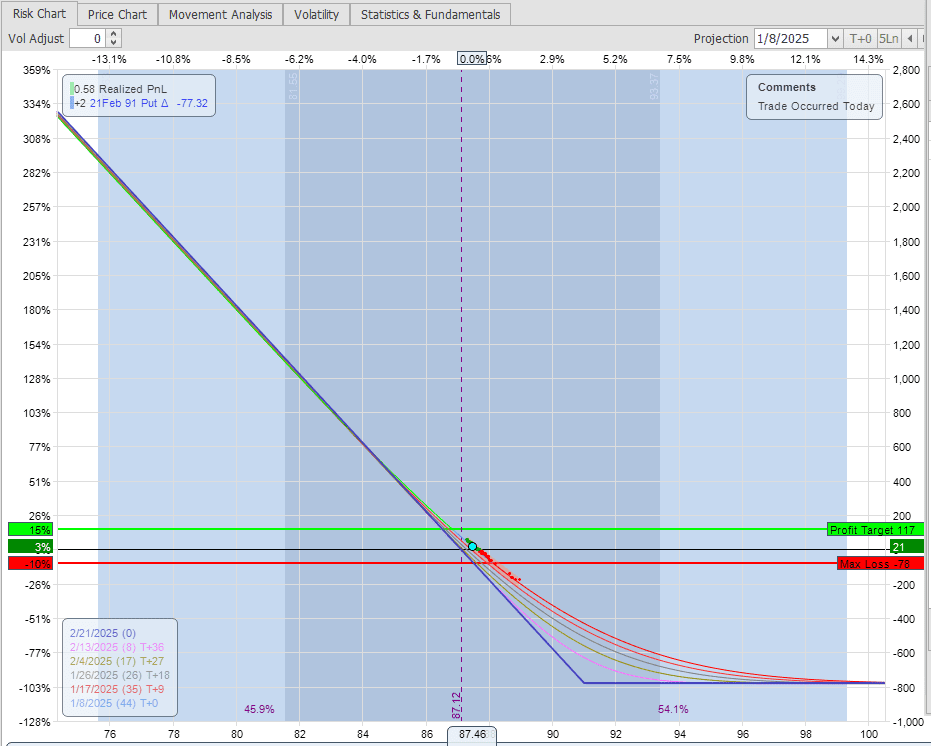
With $780 maximum risk.
My current Position Summary now looks like this:
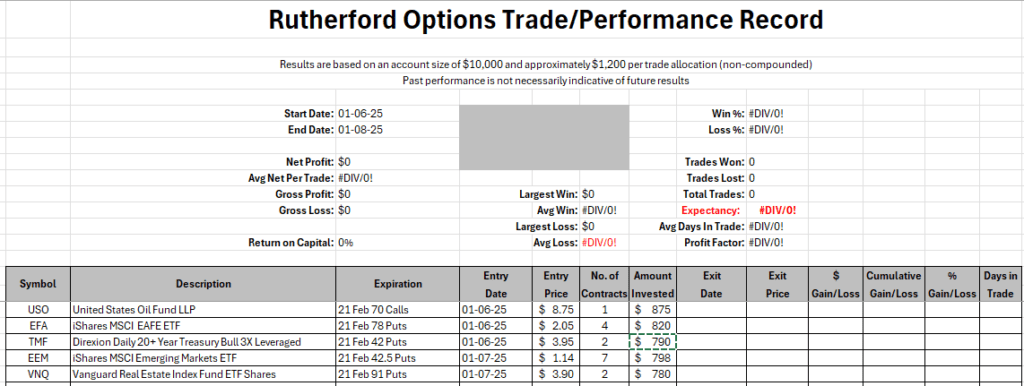
With positions in 5 of the 9 ETFs. I am fairly neutral on SPY, SLV, IBIT and SVXY so will stay out of those names for now until I detect more movement. Since there is a premium to pay for buying Options (and we are going into the next 4 days with 3 days of no market action) I want need to see potential movement to benefit. The above positions are probably more than enough to protect the Darwin portion of the portfolio if we get a pullback.
Discover more from ITA Wealth Management
Subscribe to get the latest posts sent to your email.
Good work David !(as usual) I tried writing Covered Calls for a number of years and will follow your work in this area with great interest. Thank you. John Shelton
Thanks John, Fasten your seatbelt and follow along – it will likely be a rough road. Don’t back up the truck until we see how it goes 🙂 .
Remember, this is not advice – I am an idiot and not qualified to give advice – this is for educational purposes only 🙂 – but at least I’m not cherry picking anything to show the best results – we’ll see the good, the bad and the ugly. I have no idea where this might go – but the risk on $70k is pretty small.
Normally I prefer to Sell Options (e.g. Covered Call or Option Spreads) – but since this is an “investment” site, and Buying to Open (BTO) and Selling to Close (STC) is no different from Buying/Selling shares of stock I thought it would be of interest to see how leverage can help/hurt us and whether we might have the stomach for it.
I have updated the above post to include 2 more (bearish) positions. That will likely be everything until sometime next week.