
Gardens-by-the-Bay, Singapore
This week we saw a correction in the prices of US equities that has taken us down from highs at the ~5800 resistance level to the lower boundary of the bullish trend channel that started in April:
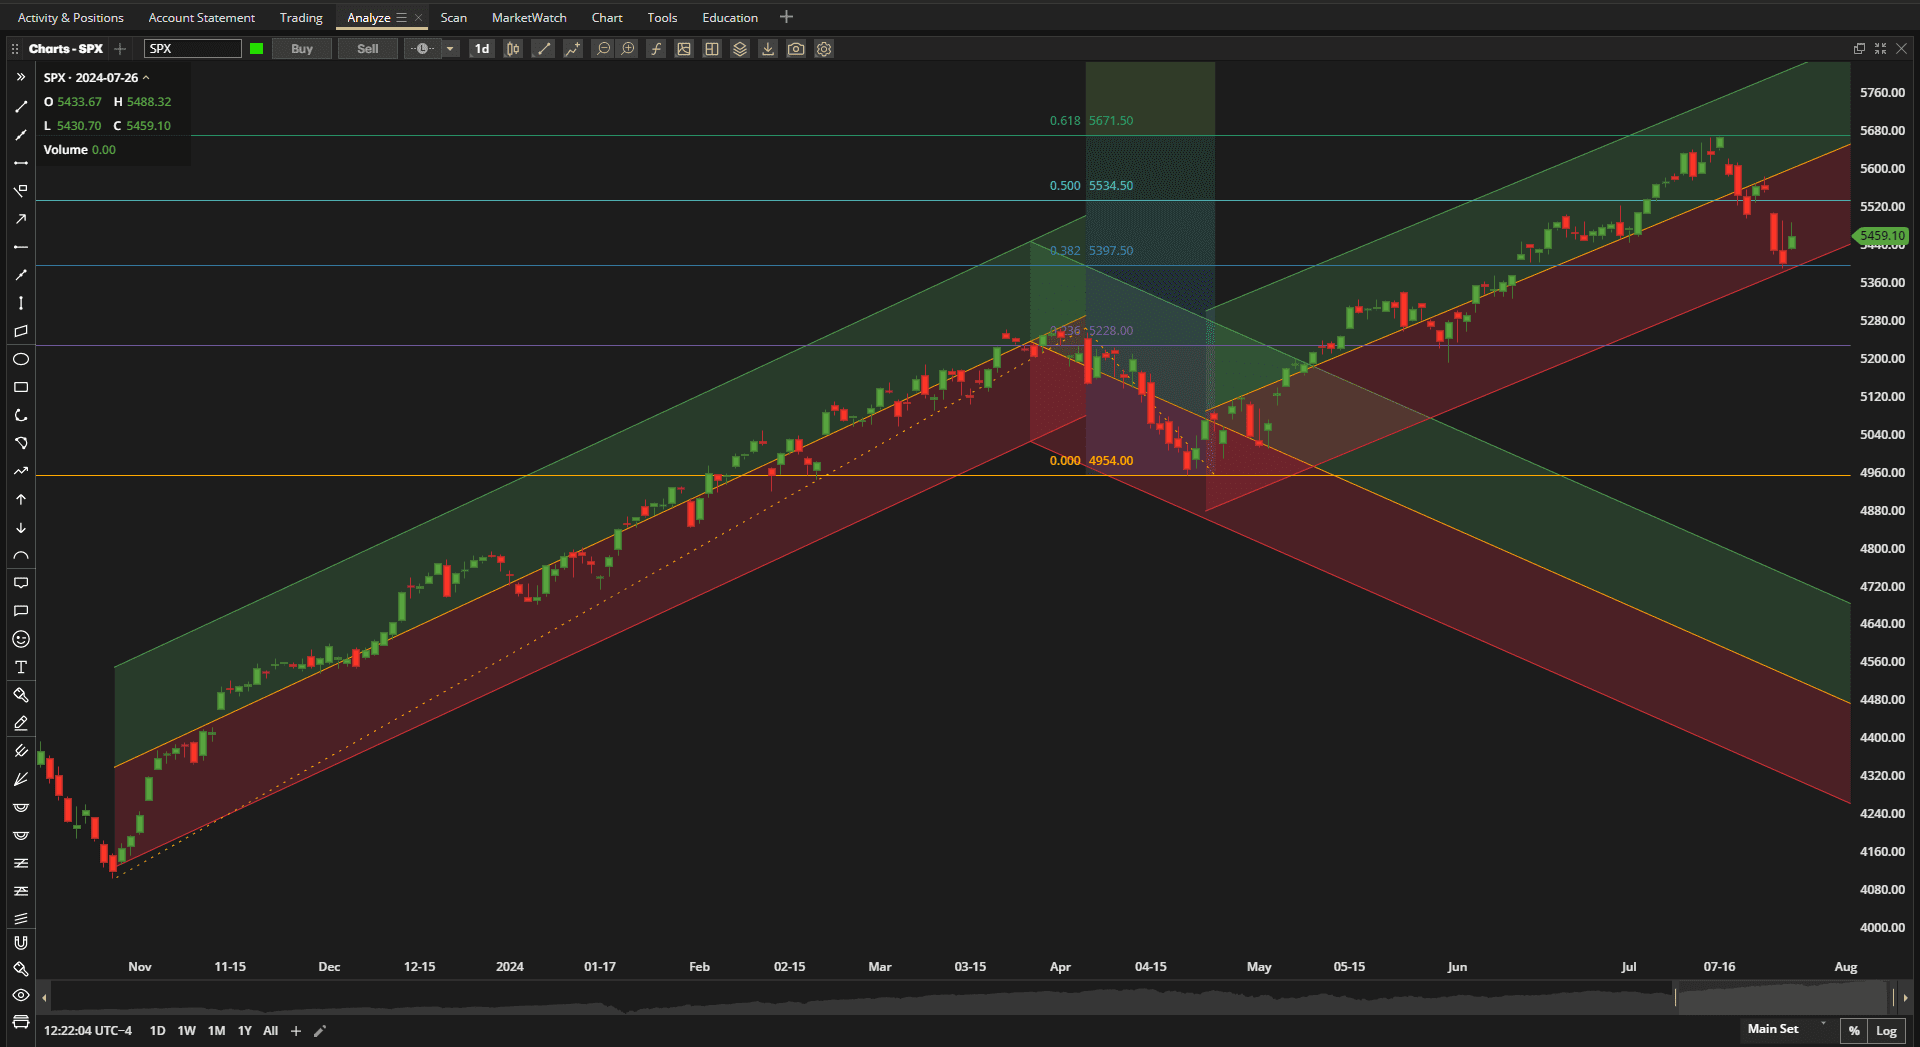 Despite the 2-week pullback, we are still in a bullish trend channel and we wait to see whether the pullback will continue from here 0r whether we see a bounce and a continualtion of the bullish trend.
Over the past week, in terms of performance relative to other major asset classes, US Equities (as represented by VTI) came in close to the bottom of the list:
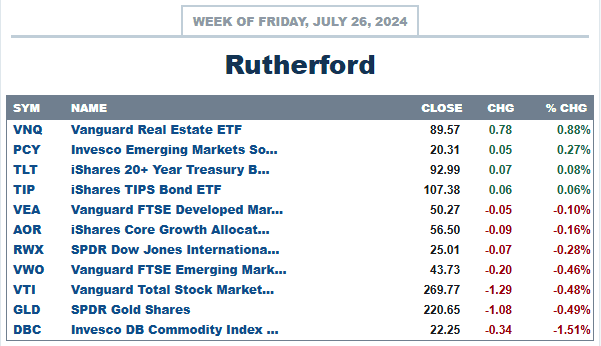 and, with the current holdings in the Rutherford portfolio looking like this:
 performance of the portfolio is reflected in the following screenshot:
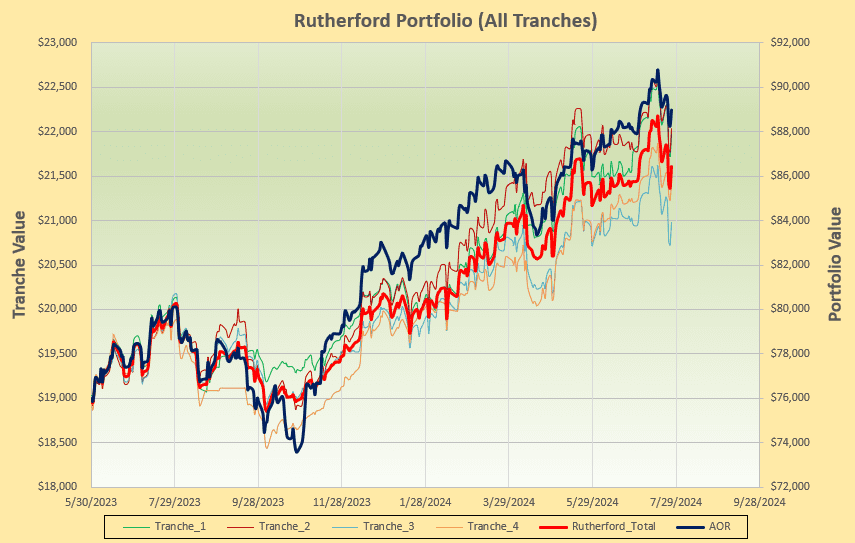 since the portfolio is presently tilted towards equities.
Checking the rotation graphs:
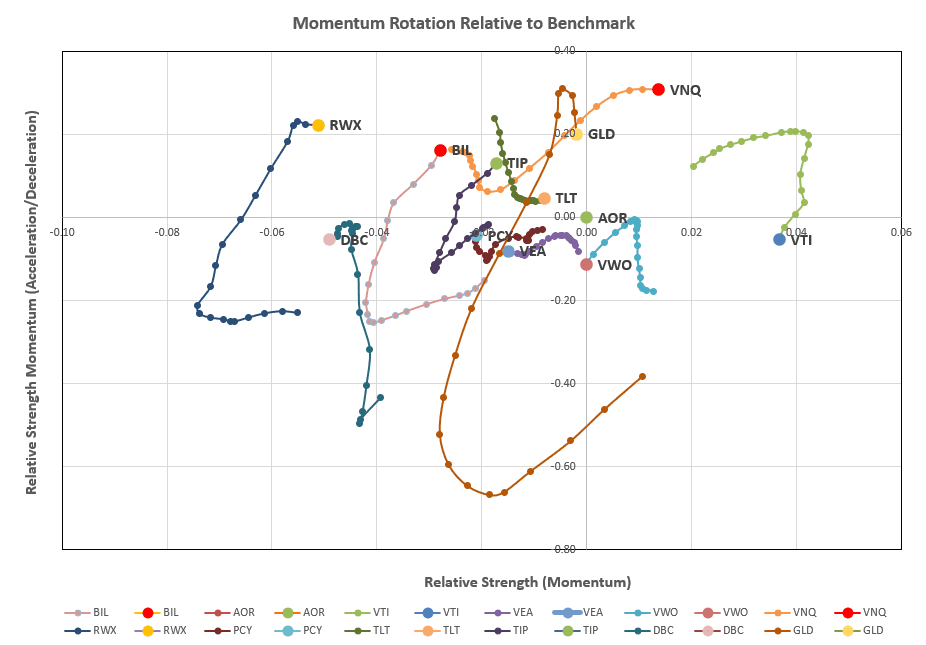 as we saw last week, only VNQ (US Real Estate) is attractively positioned in the desirable top right quadrant, with VTI now dropping into the negative zone – at least in the shorter term (i.e. below the horizontal axis).
This is reflected in the recommendations coming from the algorithm used to manage this portfolio:
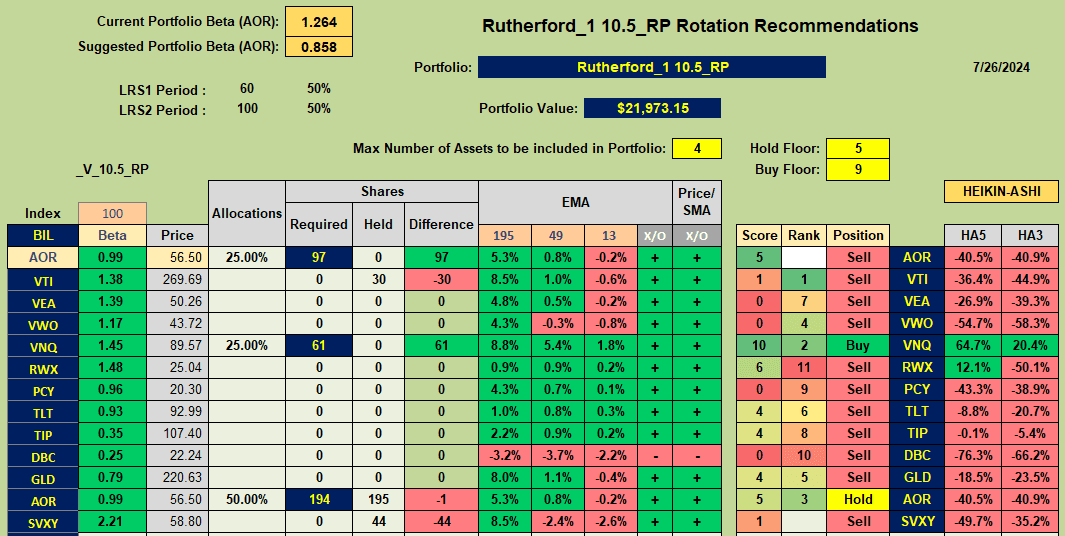 where VNQ is the only Buy recommendation and AOR (the benchmark Fund) is a Hold recommendation.
Adjustments for next week will look something like this:
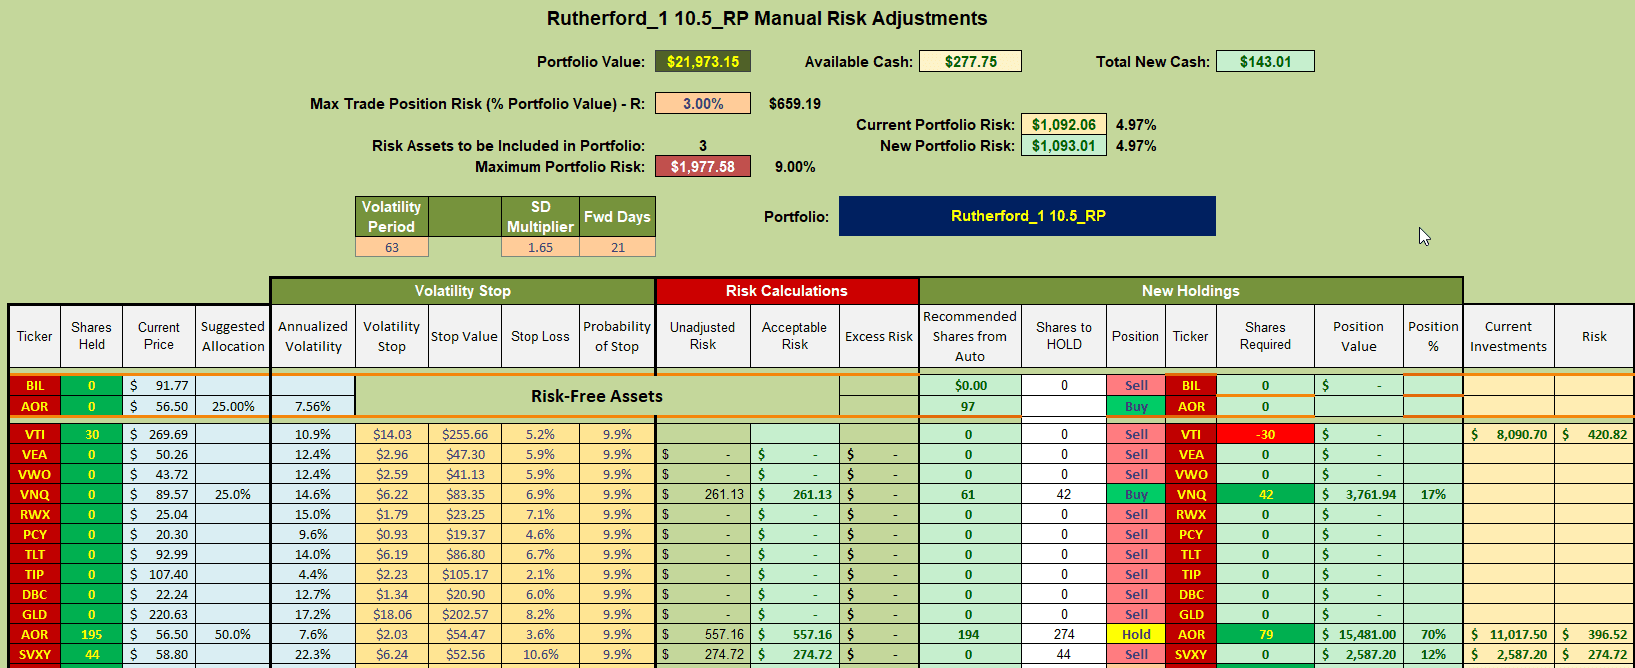 where I shall be selling current holdings in VTI to add to holdings in VNQ that began last week. I shall also continue my discretionary reduction of shares held in SVXY – the inverse volatility ETF – since I am anticipating higher volatility going into the election period in November. After adding shares of VNQ from the funds generated from the sales I shall use the remaining Cash to add more shares of AOR.
Discover more from ITA Wealth Management
Subscribe to get the latest posts sent to your email.
You must be logged in to post a comment.