
No prizes for captioning this photo in Koh Samui, Thailand
It was a weak performance in the US equity markets after the Labor Day week-end with the SPX (S&P 500 Index) down ~1.5% from last week’s close:
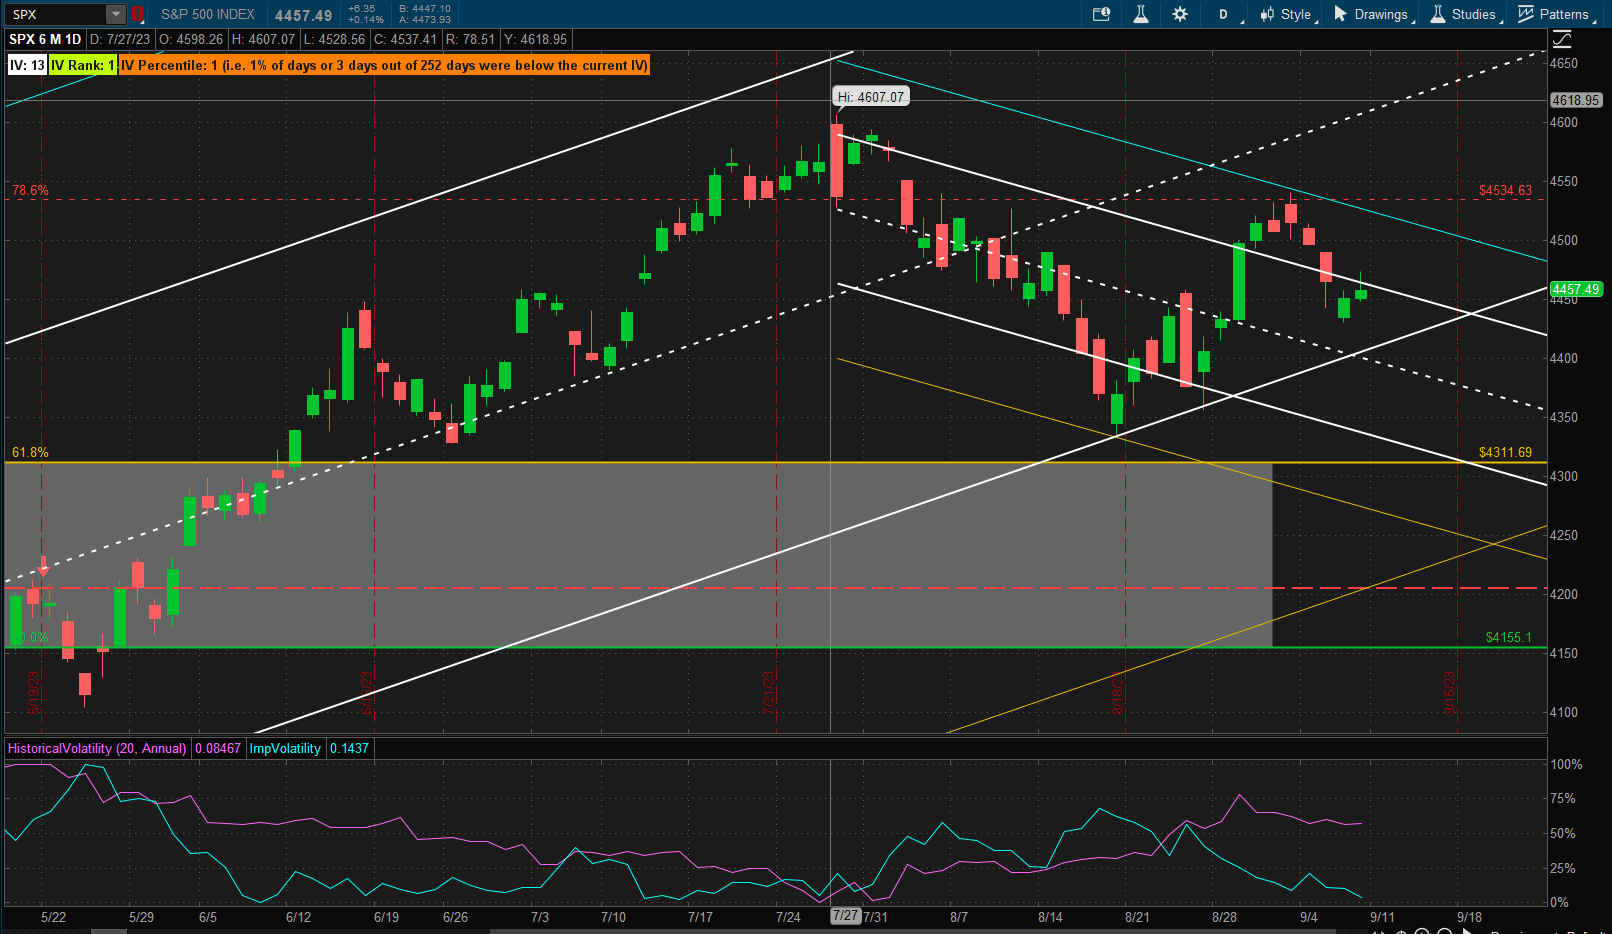 This leaves prices in a pendant pattern bounded by the upper 2 SD boundary of the short-term bearish channel (blue line) and the lower 1 SD boundary of the longer-term bullish channel (white line). Obviously we will break out of this pattern sometime in the next week (or maybe 2 weeks). Whether this breakout will be to the upside or downside is anybody’s guess – but, technically, we are still in a major uptrend.
In terms of performance relative to other major asset classes:
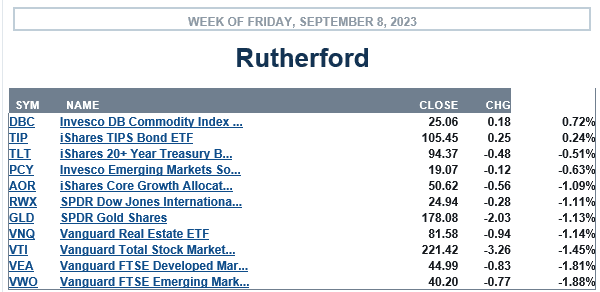 equities (both US and international) were at the bottom of the last.
Current holdings in the Rutherford Portfolio look like this:
 with performance looking like this:
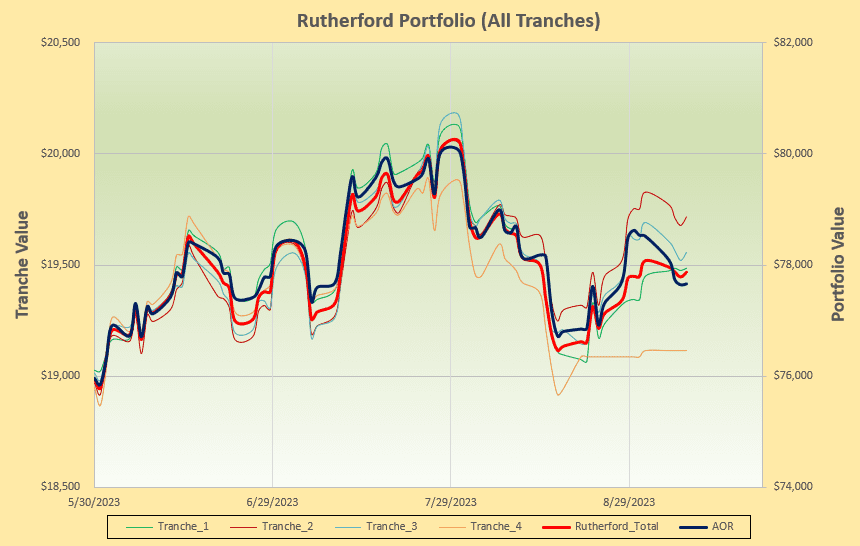 i.e. the portfolio has caught up to the performance of the benchmark AOR Fund.
So we can check the rotation graphs:
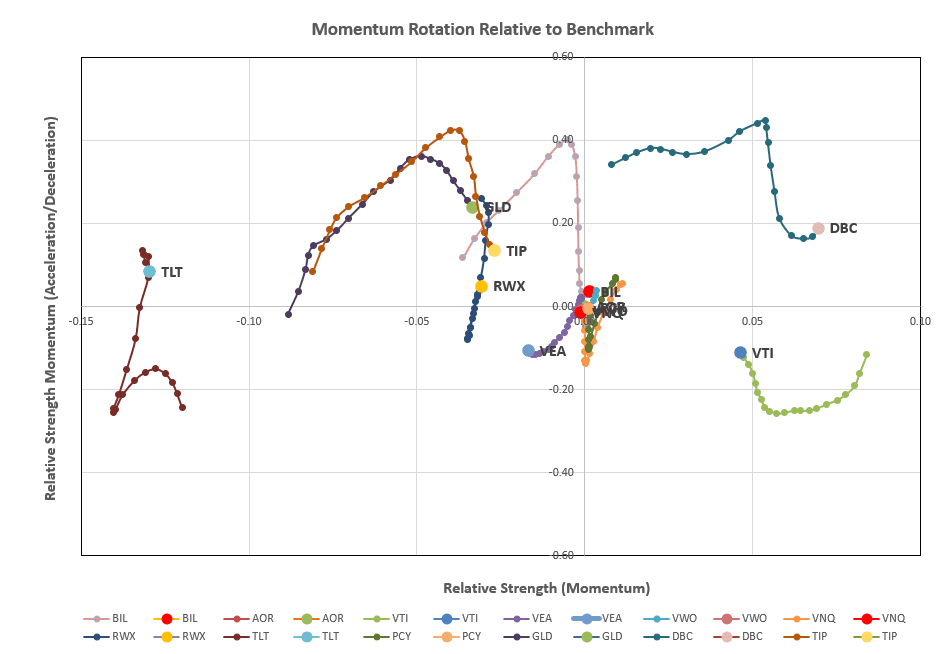 where we only see relative long-term strength in DBC and VTI (although VTI is looking weaker in the short-term).
The rotation model comes up with the following recommendations:
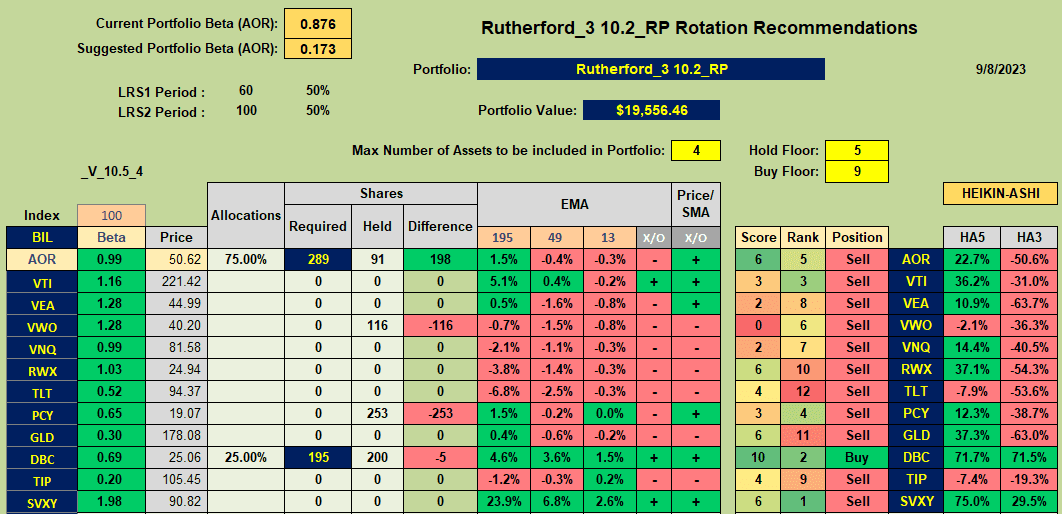 and risk parity allocations (introduced in last week’s review) result in the following adjustments:
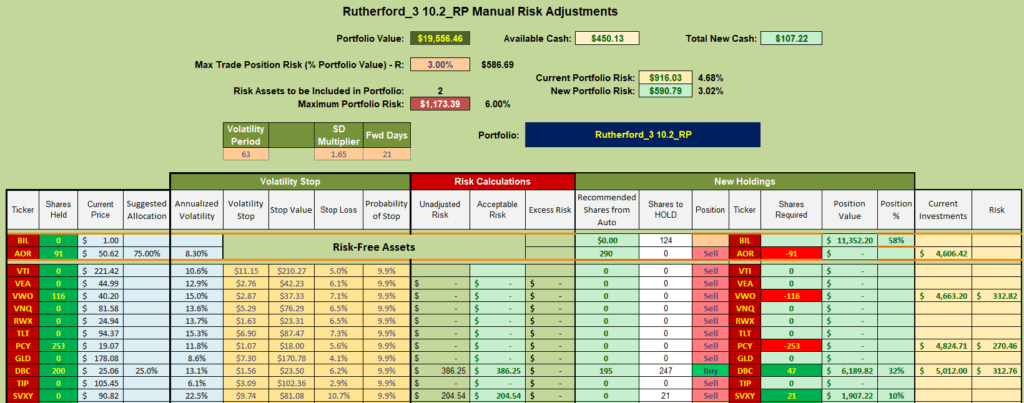 i.e I will be selling current holdings inVWO and PCY and buying shares in DBC.
The recommendation is to sell current holdings in AOR and move cash to BIL. This is a result of the fact that BIL has slightly higher momentum than AOR. However, the difference is small so I will choose to hold on to current holdings in AOR (but not add to the holdings) and only buy shares in BIL with excess cash from the other transactions (~$6,700 ~73 shares).
I will also be buying another 21 shares of SVXY for the portfolio (dollar cost averaging of my entry price) as the second stage of my plan as outlined in last week’s review (https://itawealth.com/rutherford-portfolio-review-tranche-2-1-september-2023/ )
David
Discover more from ITA Wealth Management
Subscribe to get the latest posts sent to your email.
You must be logged in to post a comment.