Ephesus Boulevard.
Before looking up any Bullish Percent Indicator data I envision or guess what the various indexes and sectors will show. Will the trends be bullish or bearish. Based on a strong Friday market I anticipated a number of the indexes and sectors would turn bullish. Not so. Technology is the one sector of the market showing any bullish tendencies.
When the actual data varies this much from my gut feeling I’ll recheck StockCharts data next Tuesday or Wednesday to make sure I have not missed something or that the data is current.
Index BPI
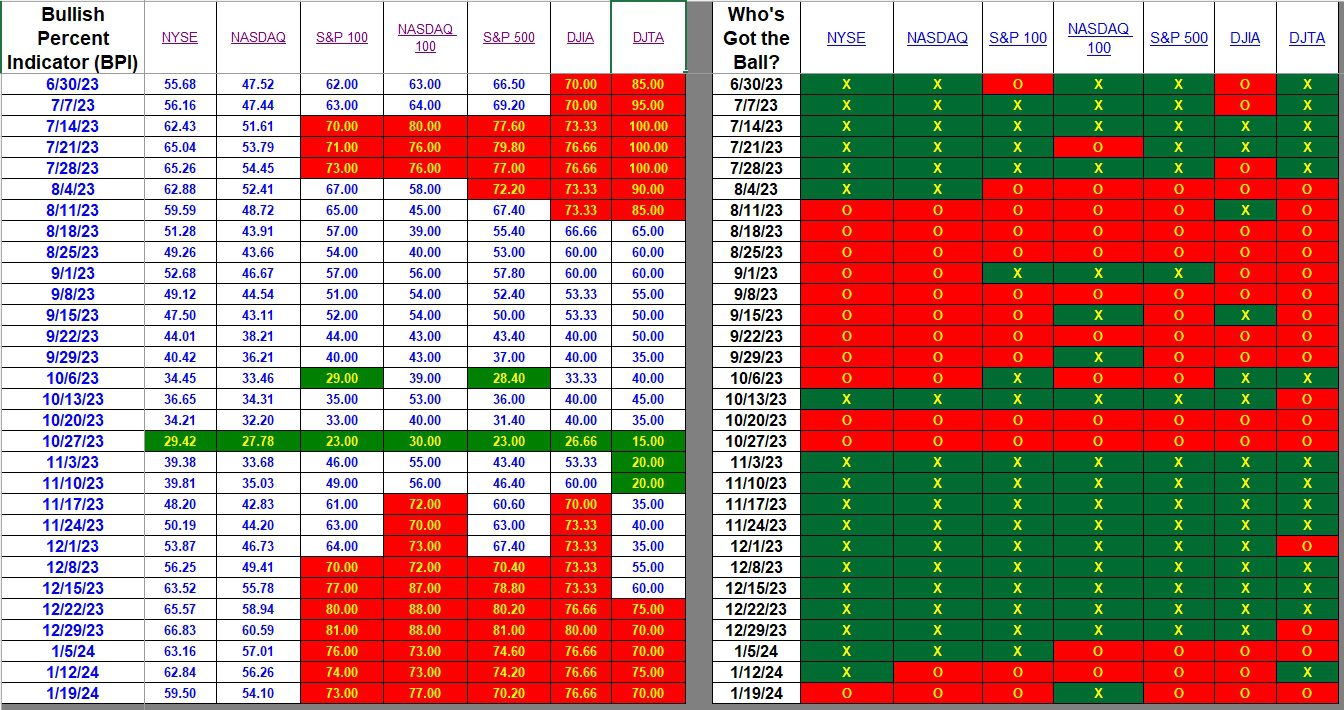
All major indexes are bearish with exception of the NASDAQ 100. Tech stocks performed very well this week. However, the three indexes I value most (NYSE, NASDAQ, and S&P 500) all lost ground. Small and Mid-Cap stocks have yet to play a major role in the current market movement. It has been months since the NYSE and NASDAQ were overbought. Large-Cap stocks continue to drive the current U.S. Stock Market.
Note that all this data is confined to the U.S. Equities market and in no way provides information as to what is going on in the international arena.
Use the right side of the table for a quick overview market action. The left side drills down and we see the percentage of bullish stocks in the different indexes and sectors of the U.S. Equities market.

Sector BPI
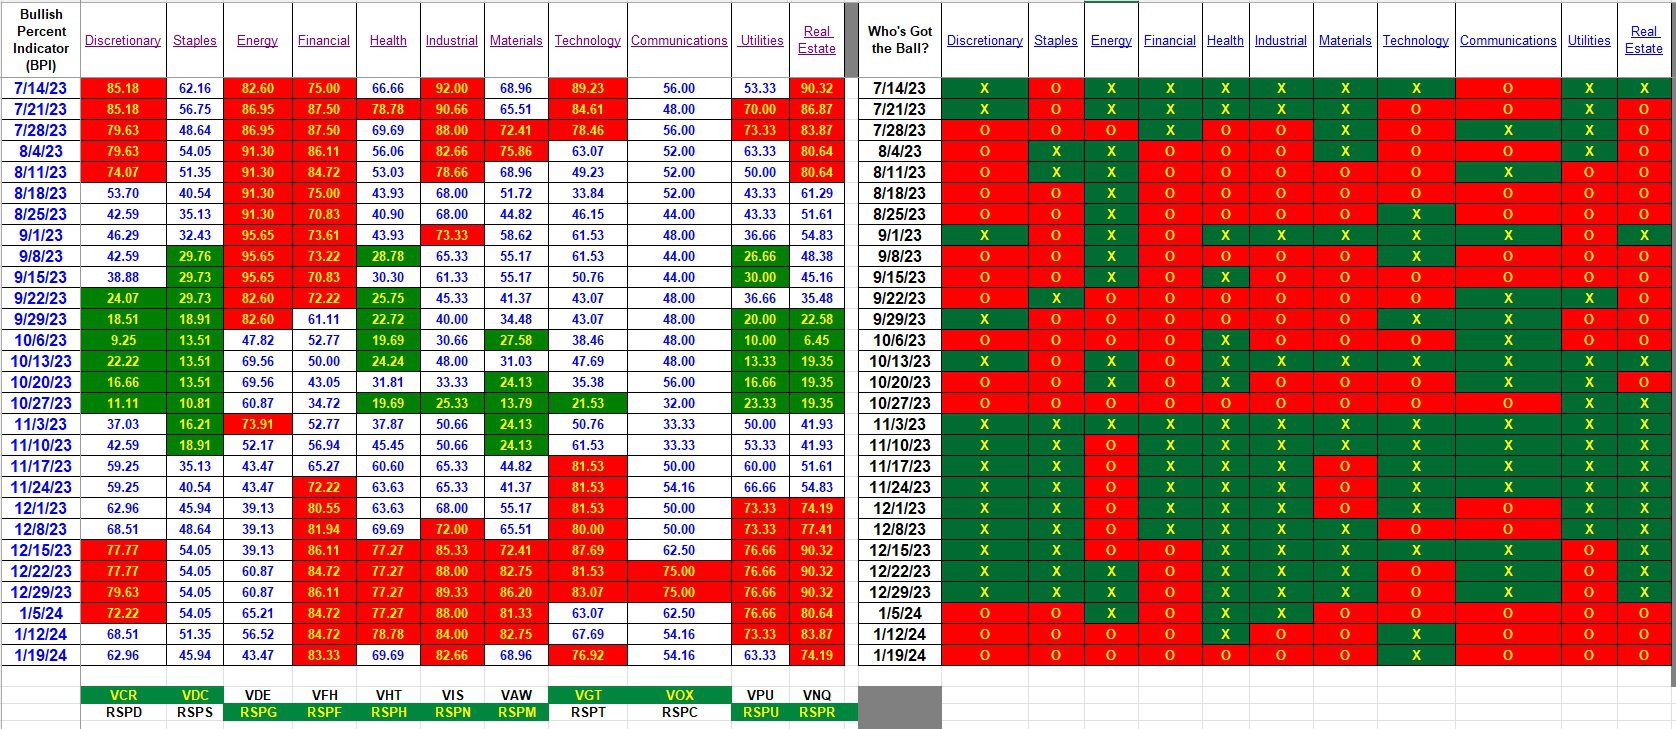
Now we come to the sectors and where guidance is provided for managing the Sector BPI portfolios. No sectors are oversold so there will not be any buying opportunities in the near future. Financial, Industrial, Technology, and Real Estate are overbought. In all the Sector BPI portfolios, Trailing Stop Loss Orders (TSLOs) have been in place for overbought sectors. In fact, most of the overbought sectors were sold out of the portfolios as the TSLOs were struck earlier this month.

Comments are always welcome.
Portfolios scheduled for reviews next week are: McClintock, Copernicus, and Bohr.
Discover more from ITA Wealth Management
Subscribe to get the latest posts sent to your email.
You must be logged in to post a comment.