
Windmills in Eastern Oregon
Earlier today I posted Internal Rate of Return (IRR) data on the Sector BPI Plus portfolios. This review of the Carson, one of four Sector BPI portfolios, walks readers through the process of how to manage a sector portfolio.
Carson Investment Quiver
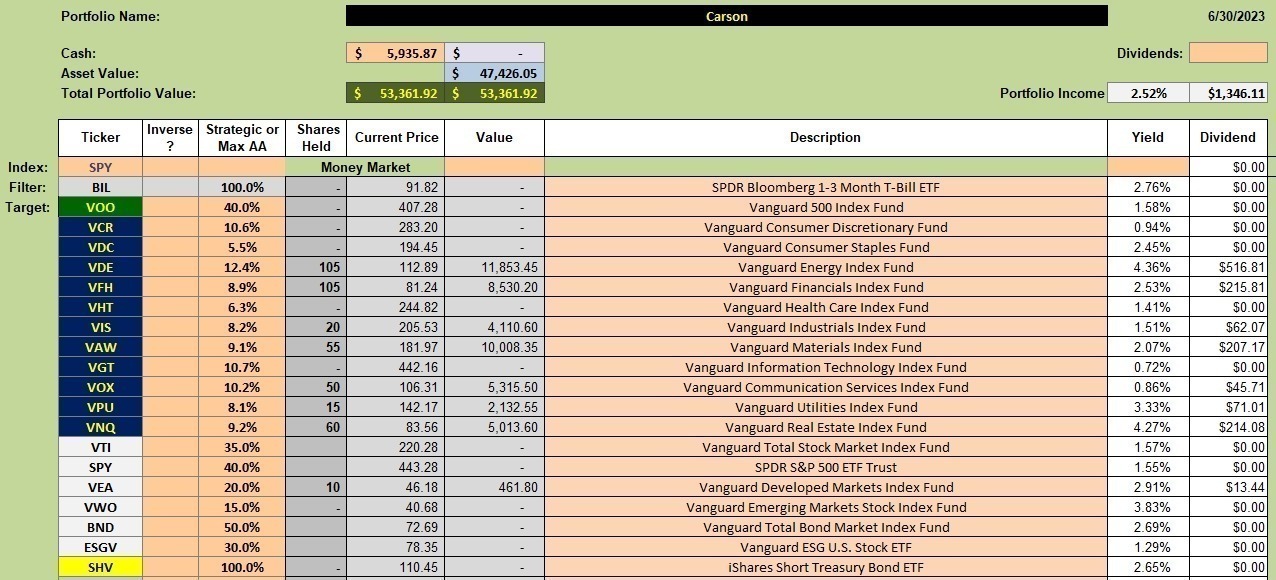
Below is the current investment quiver and holdings in the Carson. The sector ETFs are those with the dark blue background. Shares are held in seven of the eleven sectors as those sectors were recommended for purchase sometime over the past few months. Early this morning I posted BPI data and Real Estate (VNQ) is the latest sector showing a Sell recommendation as the Bullish Percent Indicator (BPI) moved above the 70% bullish mark. When this occurs we place a Trailing Stop Loss Order (TSLO) under the ETF. Rather than sell immediately the TSLO permits the price of the sector ETF to move higher.
Note the nearly $6,000 held in cash. What to do with this amount of money when no sectors are recommended for purchase? Read on.
Carson Security Recommendation
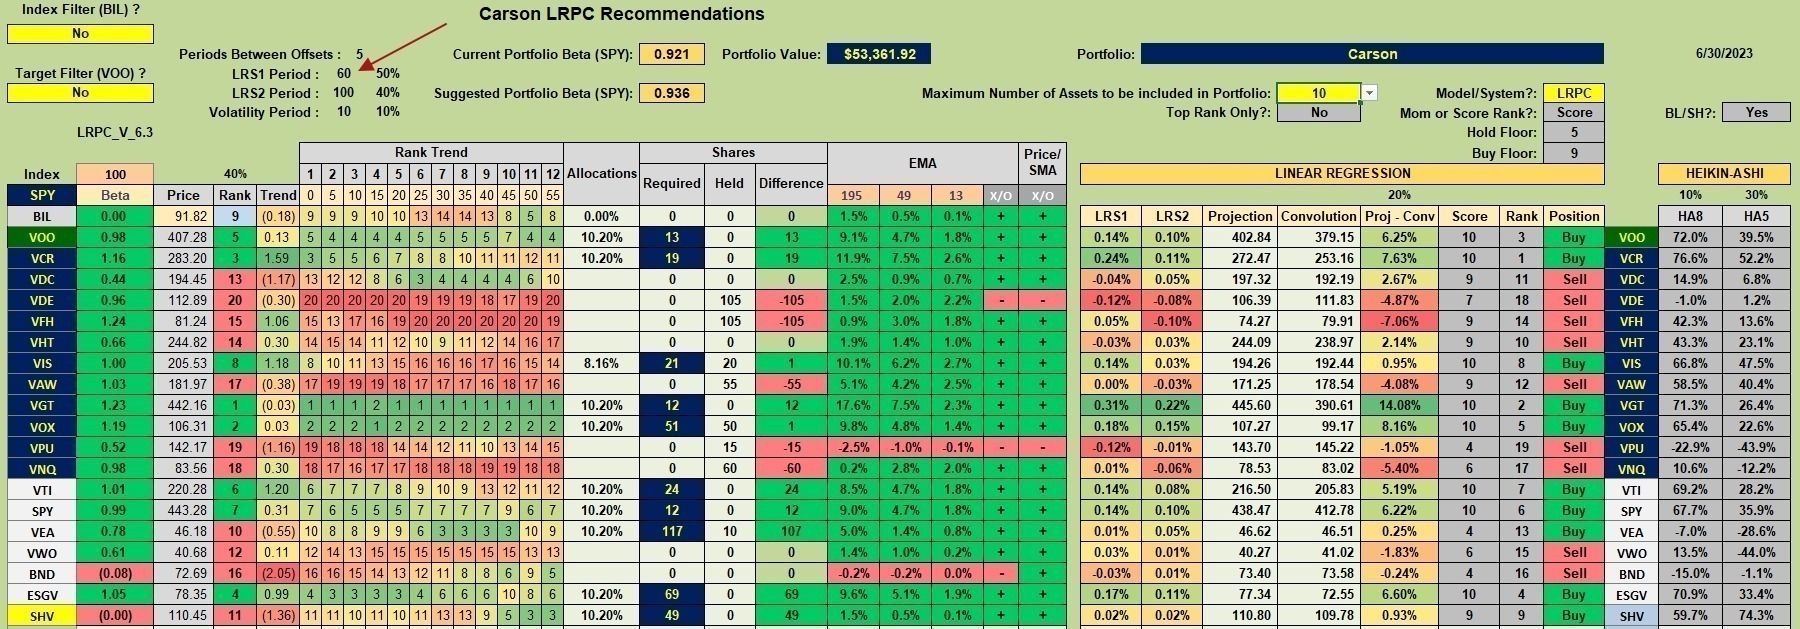
The following worksheet comes out of the Kipling spreadsheet. The red arrow points to the “default” look-back combination and I have the investing model set to LRPC. When using this model we move to the Rank shown in the 4th column from the left.
When no sectors are recommended for purchase and cash is available we look for the highest ranked ETF from the following group: VOO, VTI, SPY, VEA, VWO, BND, ESGV, and SHV. I intend to add AGG to the investment quiver as well. From this group of securities we see where ESGV is the highest with a #4 rank. We pass over VGT, VOX, and VCR as they are sector ETFs and we use BPI logic when selecting them for purchase.
If you back up to the first screenshot you will see that the maximum percentage one can hold in ESGV is 30%. Should there be more than sufficient cash to fill the 30% limit for ESGV, one moves to the next highest rank. That would be VOO as it is ranked #5.
Special Note: When using the Buy-Hold-Sell (BHS) model we use the ranking column found in the 5th column from the right.
Carson Manual Risk Adjustment
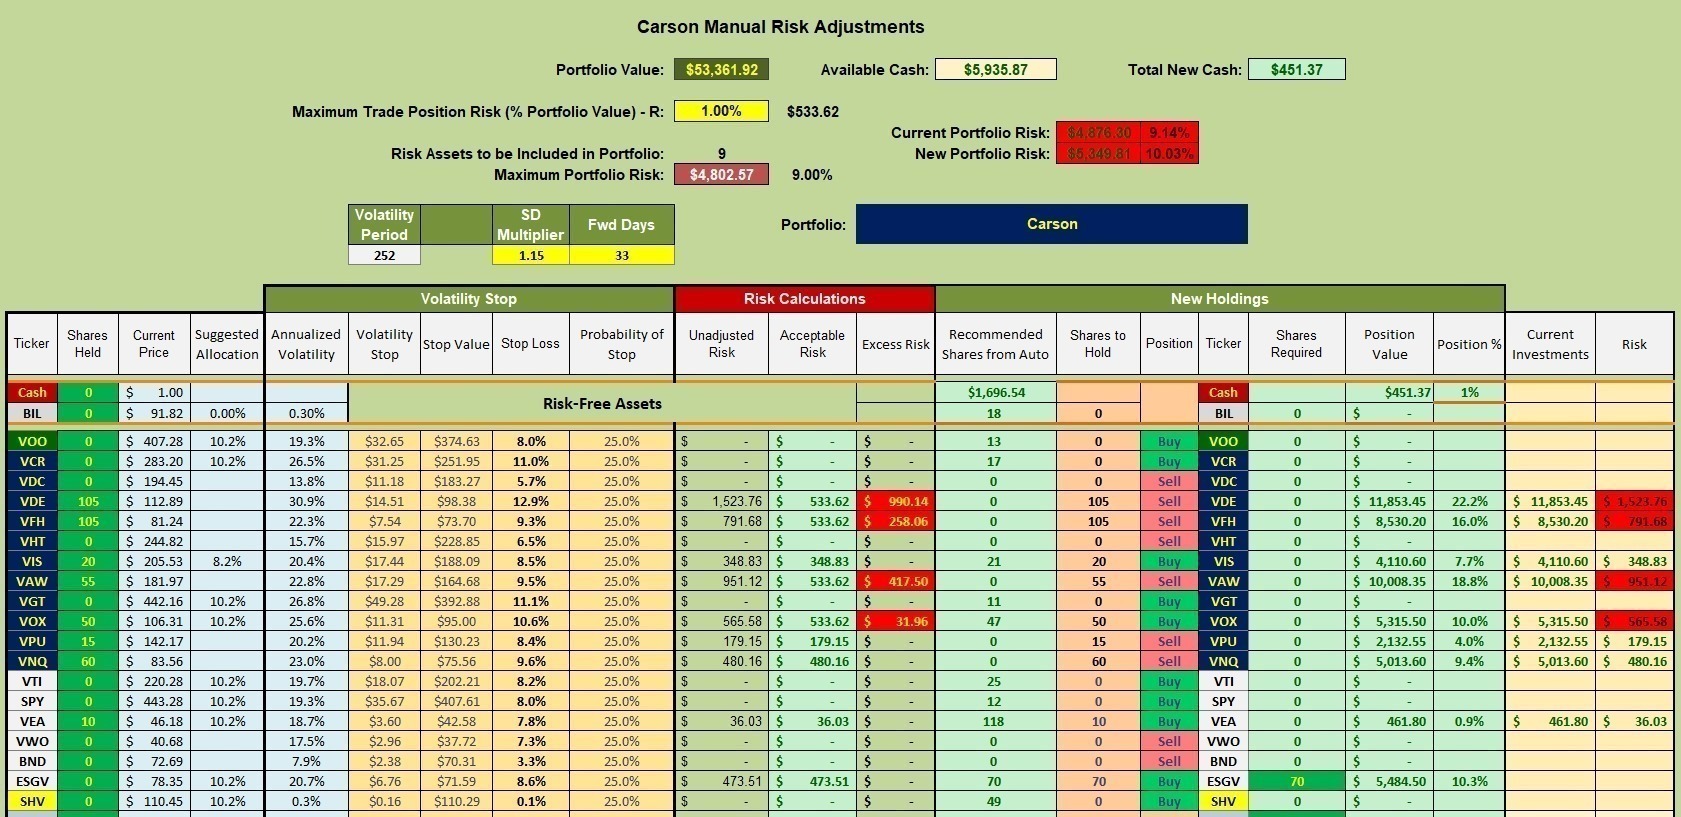
The manual risk adjustment worksheet aids users in knowing how many shares we can purchase before running out of cash. As of 6/30/2023 we can purchase 70 shares of ESGV. After the market opens on Monday I’ll place limit orders to pick up 70 shares of ESGV.
A TSLO is already in place to sell 60 shares of VNQ as that was the recommendation from the most recent BPI data – posted earlier this morning.
Carson Performance Data
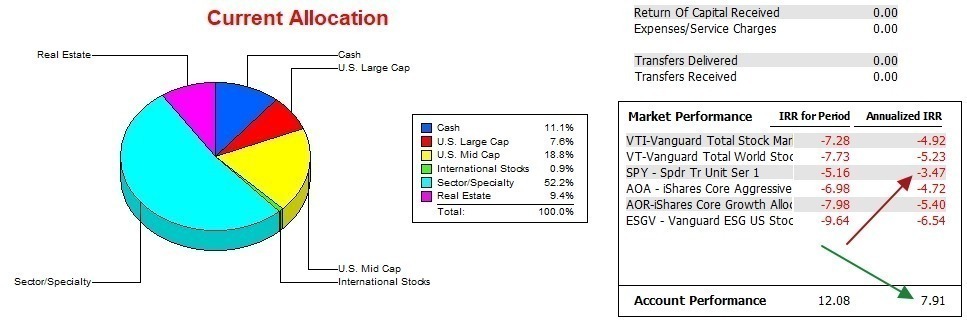
With 1.5 years of data now available, how well has the Carson performed? The annualized IRR is 7.9% while the SPY (S&P 500) lost 3.5%. The Carson performed even better when compared to other potential benchmarks. The IRR for the 18 months is 12.1% while SPY is down 5.2%. It will not be easy to maintain this huge delta between the Carson and its benchmark.
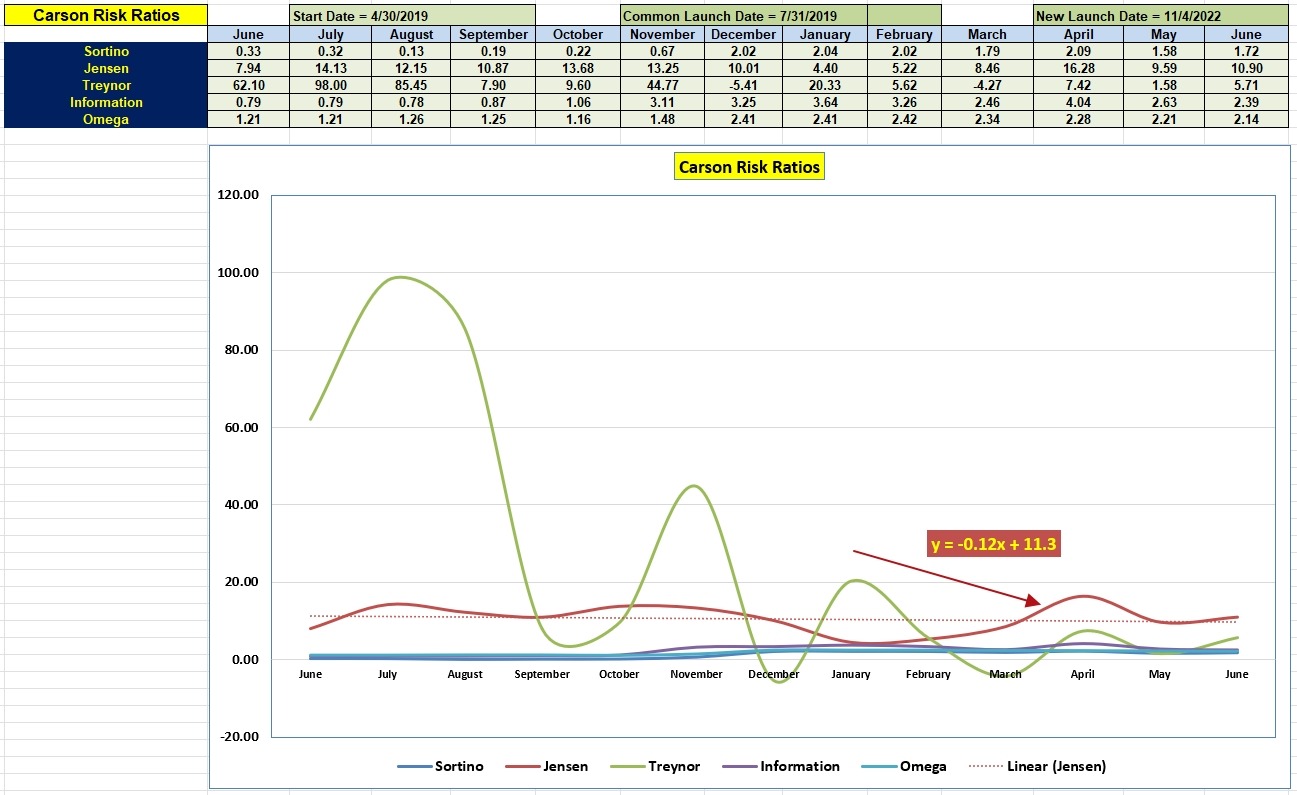
Carson Risk Ratios
The following risk data is unique to the ITA blog. At least I’ve never seen this information published this way for individual portfolios. The three most important ratios in order of importance are: Jensen Alpha, Information Ratio, and Sortino Ratio. The Jensen also goes by the title, Jensen Performance Index. A Jensen value of 10.9 is unusually high and one cannot be expected to maintain this level month after month.
All values are strong although we want to see the slope of the Jensen turn from a negative to a positive.
Tweaking Sector BPI Plus Model: 20 May 2023
Discover more from ITA Wealth Management
Subscribe to get the latest posts sent to your email.
Be sure to check out this blog post for more information on Sector BPI Plus investing.
https://itawealth.com/sector-bpi-update-30-june-2023/
Lowell