Westlake, California
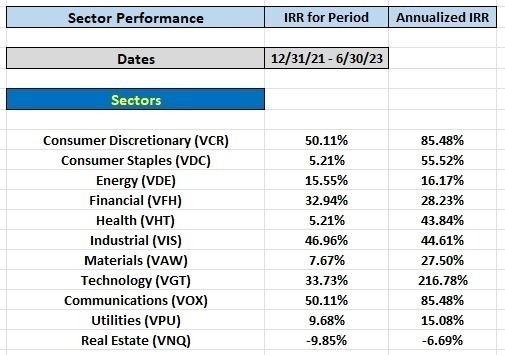
This past week I posted Internal Rate of Return (IRR) data for the combined performance of sectors used in the four Sector BPI Plus portfolios tracked here at ITA. Publishing only IRR data, while truthful, can be misleading when securities are held for short periods. The following data provides more information as it includes the IRR data for the period held as well as the annualized IRR data.
The following information covers the time frame from 12/31/2021 through 6/30/2023. Real Estate is the only sector in negative territory and the Sector BPI portfolios still hold this ETF. Updating this information each quarter will help readers better understand how well the Sector BPI Plus model is performing.
Keep in mind that the Plus is an addition to the original Sector BPI model and is designed to patch a potential hole should a sector be sold, only to rebound into the overbought zone without ever moving down to the oversold zone. This requires additional explanation and you will find detailed information when the different Sector BPI portfolios are reviewed.

Questions and comments are welcome. Post them in the Comment space provided below.
Note: The ITA blog is free to all who register as a Guest.
Discover more from ITA Wealth Management
Subscribe to get the latest posts sent to your email.
Lowell,
I’m afraid that I don’t understand where these numbers are coming from. Just eyeballing the data I don’t see any sectors that have positive returns over the 12/31/21 – 6/30/23 period (the past 18 months) – therefore I don’t see where the positive IRRs are coming from/how they are calculated ??
e.g. how do you get a 50% IRR from this: https://www.dropbox.com/s/kffdm8afot9q9hw/IRR%20VCR%202023-07-02_19-20-46.png?dl=0
David,
The data comes directly from the commercial software, Investment Account Manager (IAM). None of the sector ETFs were held for the entire period so it depends on when the sector ETF was purchased and when it was sold.
As one can see from the data, the annualized IRR values tend to be much higher than the IRR over the designated period as most were held for rather short periods of time – say a few months.
In every case the ETF was sold at a higher price than the purchase price with exception of Real Estate and VNQ is still held in several Sector BPI portfolios.
Does this make sense?
Lowell
Lowell,
Ok – I got it 🙂
I have IAM – but I’m not using it because I find it time consuming to enter everything and prefer to see the visual graphic performance that I plot from the spreadsheets. But that’s just my personal preference.
It will be interesting to see how the BPI works over a 2-3 year period that includes downturns. How will you manage a downturn if you’ve entered long on the oversold signal, got a bounce – but not far enough to go into the overbought region, and there’s a continuation of the downtrend? I see this as very similar to using RSI signals.
David
David,
If I want visual plots, they are available within IAM. Detailed output does require the effort to enter the data. I don’t find it oppressive, particularly for portfolio where there are few transactions. I’m tracking 15 portfolios using IAM, more than most investors.
As for handling downturns, the Sector BPI model suggests hanging on until the sector returns to the oversold zone. This might require waiting for periods in excess of a year. Not a problem and better tax wise.
I looked back over BPI data going back to 2012 and there is Buy/Sell action in one or more sectors each six months. Even in 2022 there is plenty of buy and selling opportunities.
When excess cash is available I’ll move over to examine broad equities and bonds as I am doing this morning with the Bohr portfolio.
Each month I add more useful information as to how the model is working. So far I’m very pleased with the results.
Lowell
David,
Here is the link to the software I’m using. Note that it is supported by AAII.
https://www.investmentaccountmanager.com/
I actually used this software back when it was a DOS program as I’ve “known” the two developers for many years. Then I moved to Captools until they stopped supporting their software for the small user.
I’ve tested the results with Excel XIRR, Captools, and the old TLH Spreadsheet developed by Jim Thomas.
Lowell