
Lake Oswego – Columbine Sculpture
Carson is one of five Sector BPI portfolios and is the oldest here at ITA. At its basic, Sector BPI investing is a reversion-to-the-mean approach. When a sector reaches 70% or more bullish stocks, we place a TSLO sell order as the sector is classified as overbought. Bullish indicators are based on Point and Figure (PnF) graphs. PnF graphs are a different way to view stock performance. If a sector drops to 30% or fewer bullish stocks, we purchase an ETF that includes stocks in that particular sector. A Sector BPI graph of 30% or lower is considered oversold and therefore has a high probability of rising in the future. The U.S. stock market is made up of eleven (11) different sectors and I follow the sector BPI data at least weekly. If there is a major market move either up or down, I check the BPI charts.
Carson Security Holdings
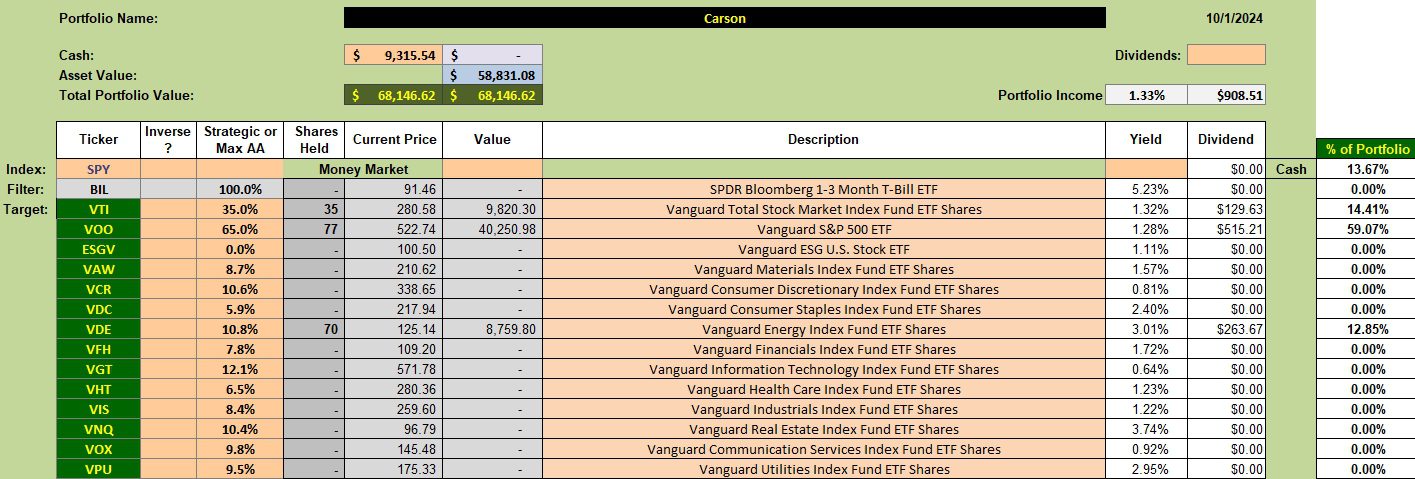
When last updated, only Energy was oversold and when this information became available we purchased shares of VDE. Recently, VCR and VDC were sold as their 3% TSLOs were triggered. With only one sector holding shares we turn to VOO and VTI as investing opportunity alternatives. Limit orders are in place to purchase more shares of VOO and VTI.
Carson Performance Data
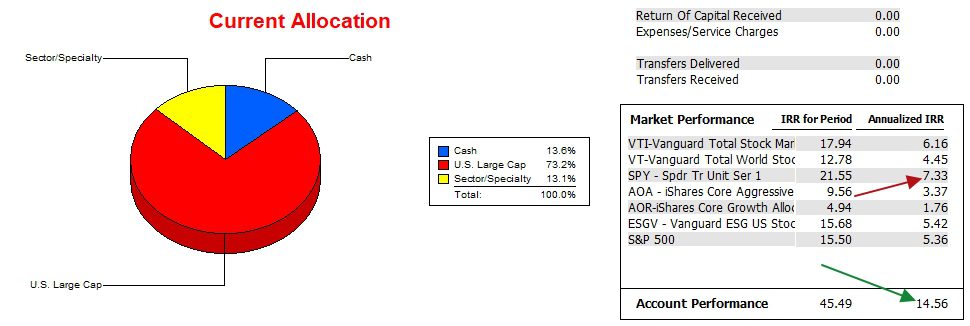
Since 12/31/2021 the Carson nearly double the SPY benchmark when annualized. As for the IRR for Period, the Carson is outpacing all potential benchmarks by a wide margin.
Carson Risk Ratios
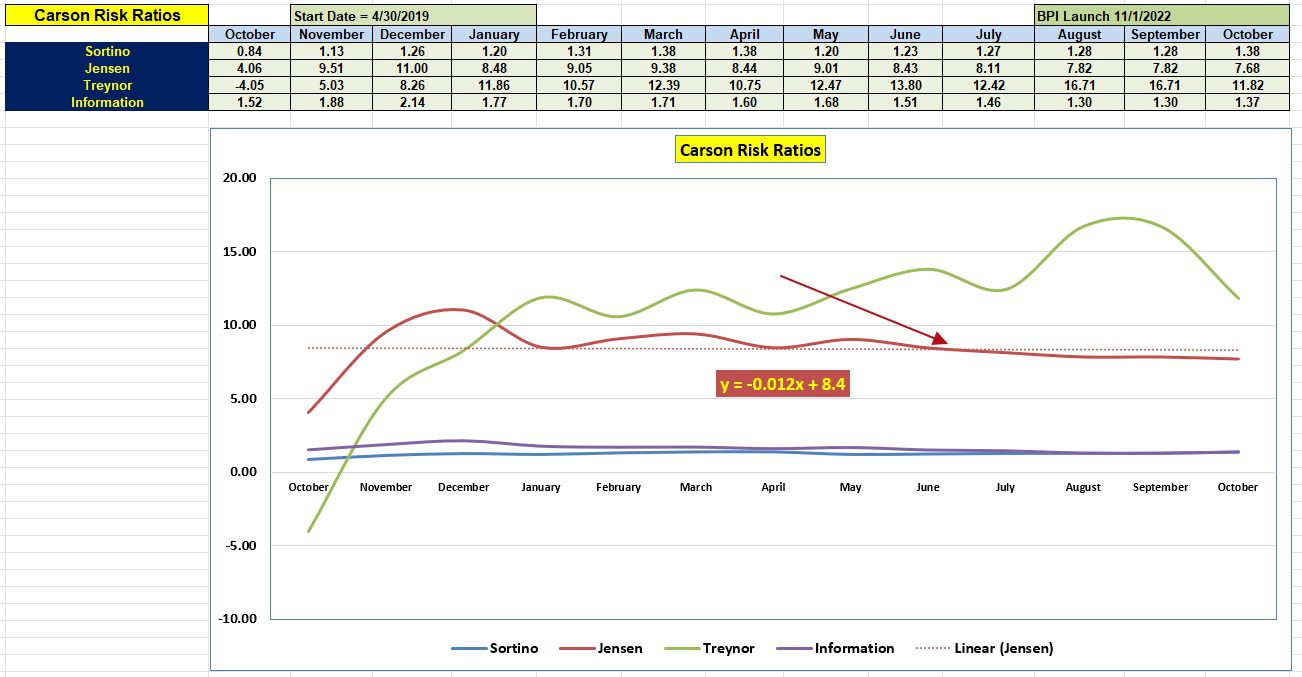
Even on a risk adjusted basis, the Carson is performing very well. Yes, the slope of the Jensen is flat and it continues to be a challenge to grow even faster when the values are initially very high.
One factor providing downward pressure on the Jensen is the high interest rate for the risk-free treasury. Within the Jensen I use SHV interest rates which are currently 5.13%. We hope this rate will decline in the future as interest rates are dropping. When that happens, Jensen will receive an upward boost.
Tweaking Sector BPI Plus Investing Model: Part II
Discover more from ITA Wealth Management
Subscribe to get the latest posts sent to your email.
Benchmarking question: Some time ago you commented the Schrodinger, a Schwab Robo Advisor portfolio, was performing better than the both the S&P500 and the SPY ETF, and you were considering adding it to your list of tracking benchmarks. Do you plan to make that refinement?
All the best,
– Lee
.
Good Morning, Lee,
The benchmarks included in the Performance Data screenshots require data I pull off the Tiingo website. Schrodinger data is not available through Tiingo. However, I do have a spreadsheet where I rank all the portfolios I track on ITA. This spreadsheet does not include portfolios tracked and reported by Hedgehunter as I don’t have sufficient information from his portfolios.
It has been many weeks since I last posted data from the spreadsheet mentioned above. Let me see if I can put that information together today so you can see the relative performance.
Copernicus is the top performer. The Carson and Schrodinger are next in line and all the rest of the portfolios fall in line after that.
Lowell
Thank you.
Based on what I read today about how a “benchmark + 2%” estimates the performance of a tax efficient portfolio, leads to an interesting question (sub-question?). How much of the Schrodinger’s performance, which exceeds SPY, is due to tax efficiency? I can understand that concept, but I don’t have the math chops to frame and display it.
This particular set of insights about tax efficiency would have been especially useful back in my 50’s and 60’s, which is why I’m sharing this with some younger families I am close to.
All the best!
Lee,
I think most of the Schrodinger performance is due to the ETFs selected and when Schwab decides to add shares. I find they tend to buy or add more shares when the market dips.
Let me add this to the tax discussion. Take three different ITA portfolios and their yields. Copernicus currently has a yield of 1.26%. The Schrodinger has a yield of 1.67%. The Pauling, an Asset Allocation portfolio, has a yield of 2.38%. One will be paying a higher tax rate on the Pauling as the income generated is taxed at the ordinary income level.
From a tax point of view it makes sense to invest in a Copernicus or Schrodinger style portfolio.
Take a young investor who is saving for retirement. It makes sense to invest in VOO or a Copernicus style portfolio where the yield is under 2% or 200 basis points. Upon retirement or when shares need to be sold to provide income, all profits are taxed at capital gains rates as all securities were held for more than one year.
I am not a tax attorney, nor am I a tax expert. However, when it comes to investing, manage portfolios in a manner so that gains are taxed at the capital rate rather than as ordinary income.
Lowell