
The Shambles, York, England
In Part 1 of this series of posts on how I intend to construct and manage the Rutherford-Darwin portfolio going forward I identified the nine ETFs that I would be using to populate the portfolio. I also indicated that, rather than holding all nine ETFs in a “Buy-and-Hold” portfolio that I would be selecting only those ETFs showing positive momentum in an uptrend.
In Part 2 I described how funds might be allocated to the ETFs to be held in the portfolio at any particular time, and how this might help control risk by targeting volatility to coincide with current market conditions with the intent of keeping drawdowns low.
In this Part 3 of the series, I will look at how we might further reduce risk whilst, at the same time, maybe generate additional “income” to add “alpha” and increase total returns.
One way to manage risk and drawdowns, of course, is to place stop-loss orders (either fixed or trailing) below the current price of the assets held in the portfolio. Personally, I don’t like doing this because, of all the reports I’ve seen, and from personal experience, this invariably reduces performance significantly – it also frustrates me when I see a bounce immediately after closing my position.
If I see weakness in one of my holdings (price pulling back) I therefore prefer to look for a way where I can continue to hold the position (unless there is an obvious change in trend) while at least reducing (hedging), if not totally eliminating, the impact of future weakness. It may also give me an opportunity to hold on to the asset until the situation becomes clearer.
If we update the chart of the position in VNQ that I posted in Part 1 of this series, we see the following:
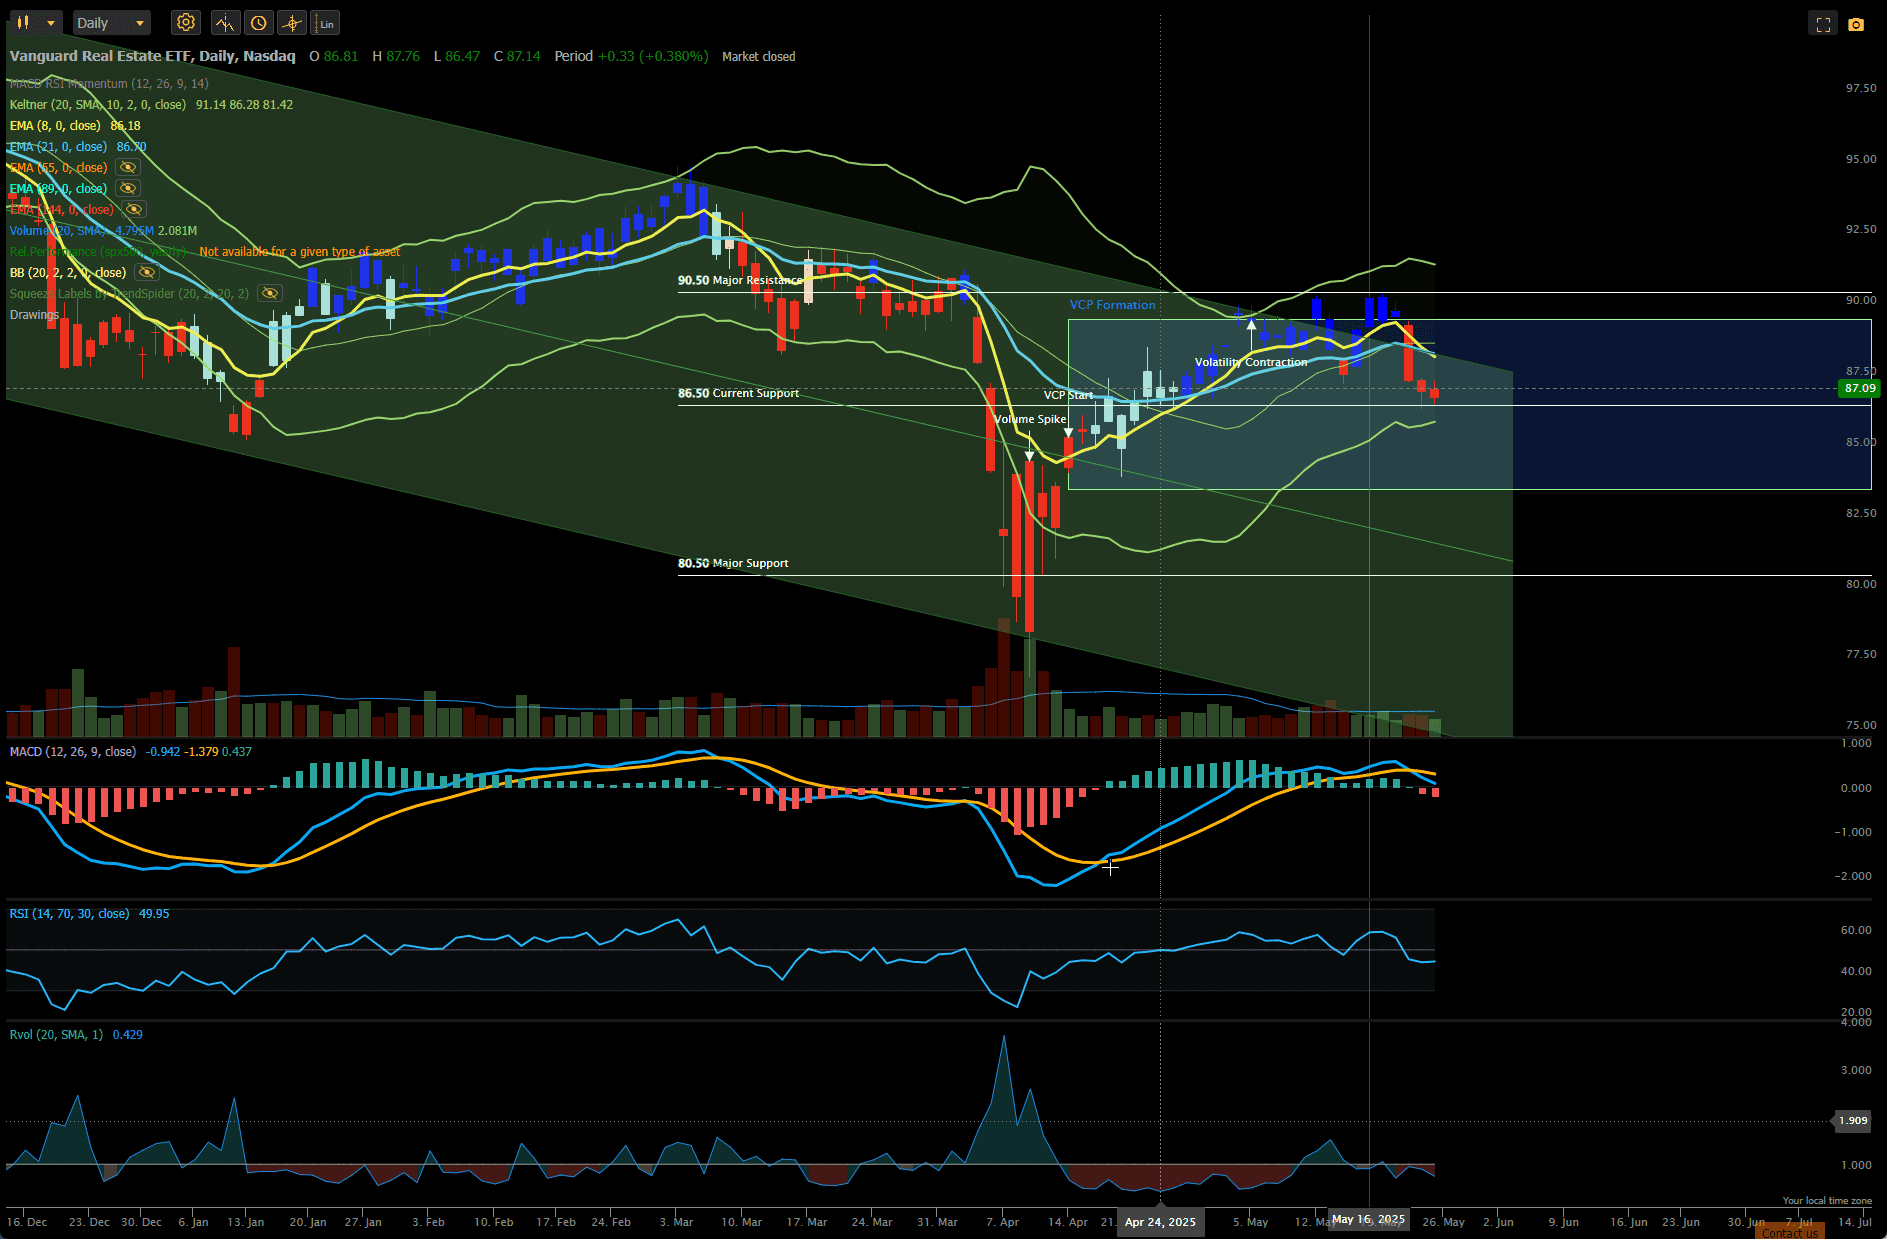 I mentioned at the time (16 May) that I might be a little premature here and, indeed, VNQ has pulled back a little towards potential support at ~$86.50. The 8-day EMA has also crossed below the 21-day EMA that would signal a reversion back into the bearish trend channel. The MACD and RSI indicators have also both turned bearish. These changes are also reflected in the recommendations from the Kipling worksheet:
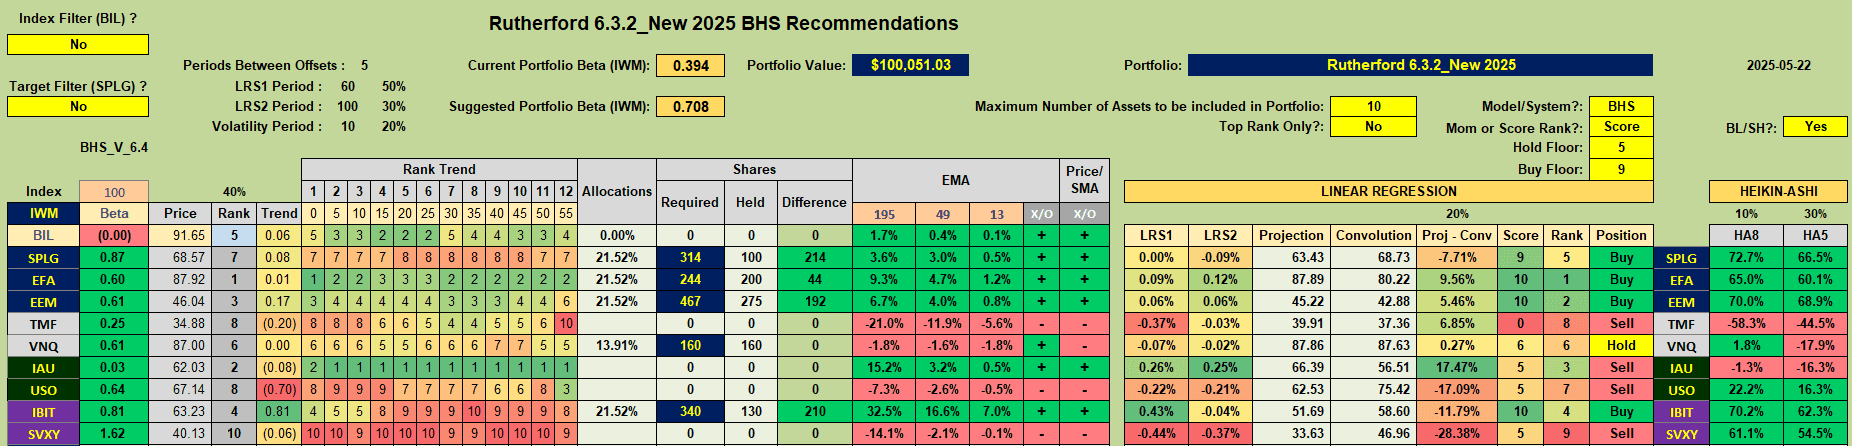 where the recommendation for VNQ has moved to a Hold recommendation. Since we are testing potential support at ~86.50 I would like to give this a little room to breathe while reducing risk. I can do this by selling a Call Option (controlling 100 shares) at the $90 strike (~ potential resistance at previous highs) and I did this on Thursday, selling a $90 strike Call Option, expiring 20 June, for a credit of $60 (0.60 per share). Assuming that price stays below $90 between now and 20 June I get to keep this $60 and book it as “income”. If price bounces and goes above $90 at expiration on 20 June, I have the option to either buy back the Option and continue to hold my 100 shares in VNQ or to let the buyer of the Option exercise the Option, buy my shares at $90, and I keep the $60 received when I sold the Option. In this case I would make 100 x ($90-$89.90 – price paid for the shares) + $60 = $70.
Since one Option contract controls 100 shares and I am only holding 160 shares I can only sell 1 Call Option against my holdings (without using margin) so my total position in VNQ currently looks like this:
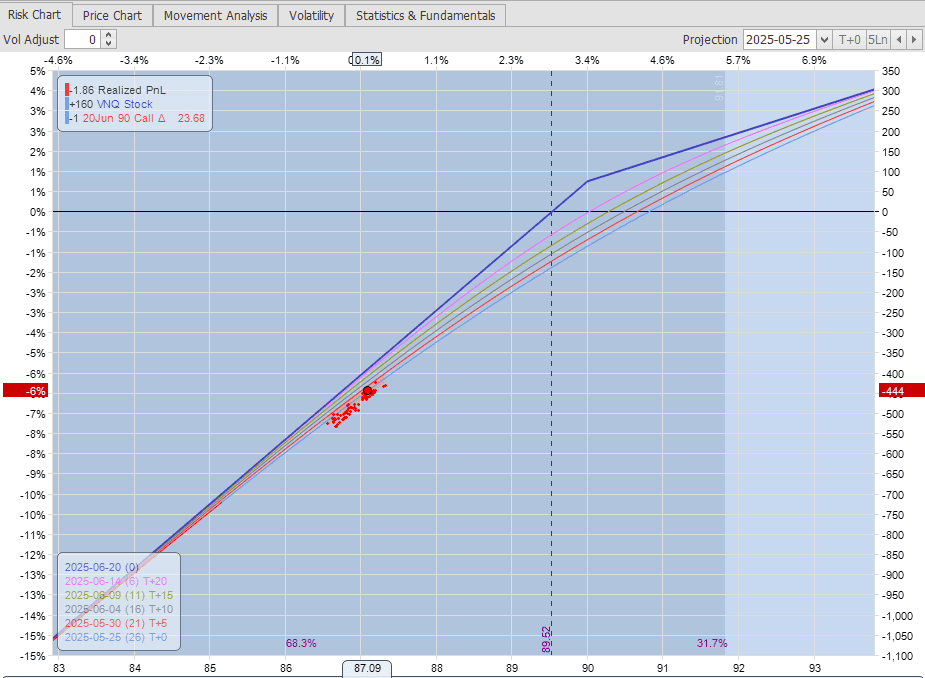
If I allow 100 of my shares to be called away, I will be left with 60 shares. Another way to look at this is that the sale of the Call Option has reduced the cost base of my shares from $89.90 to $89.30.
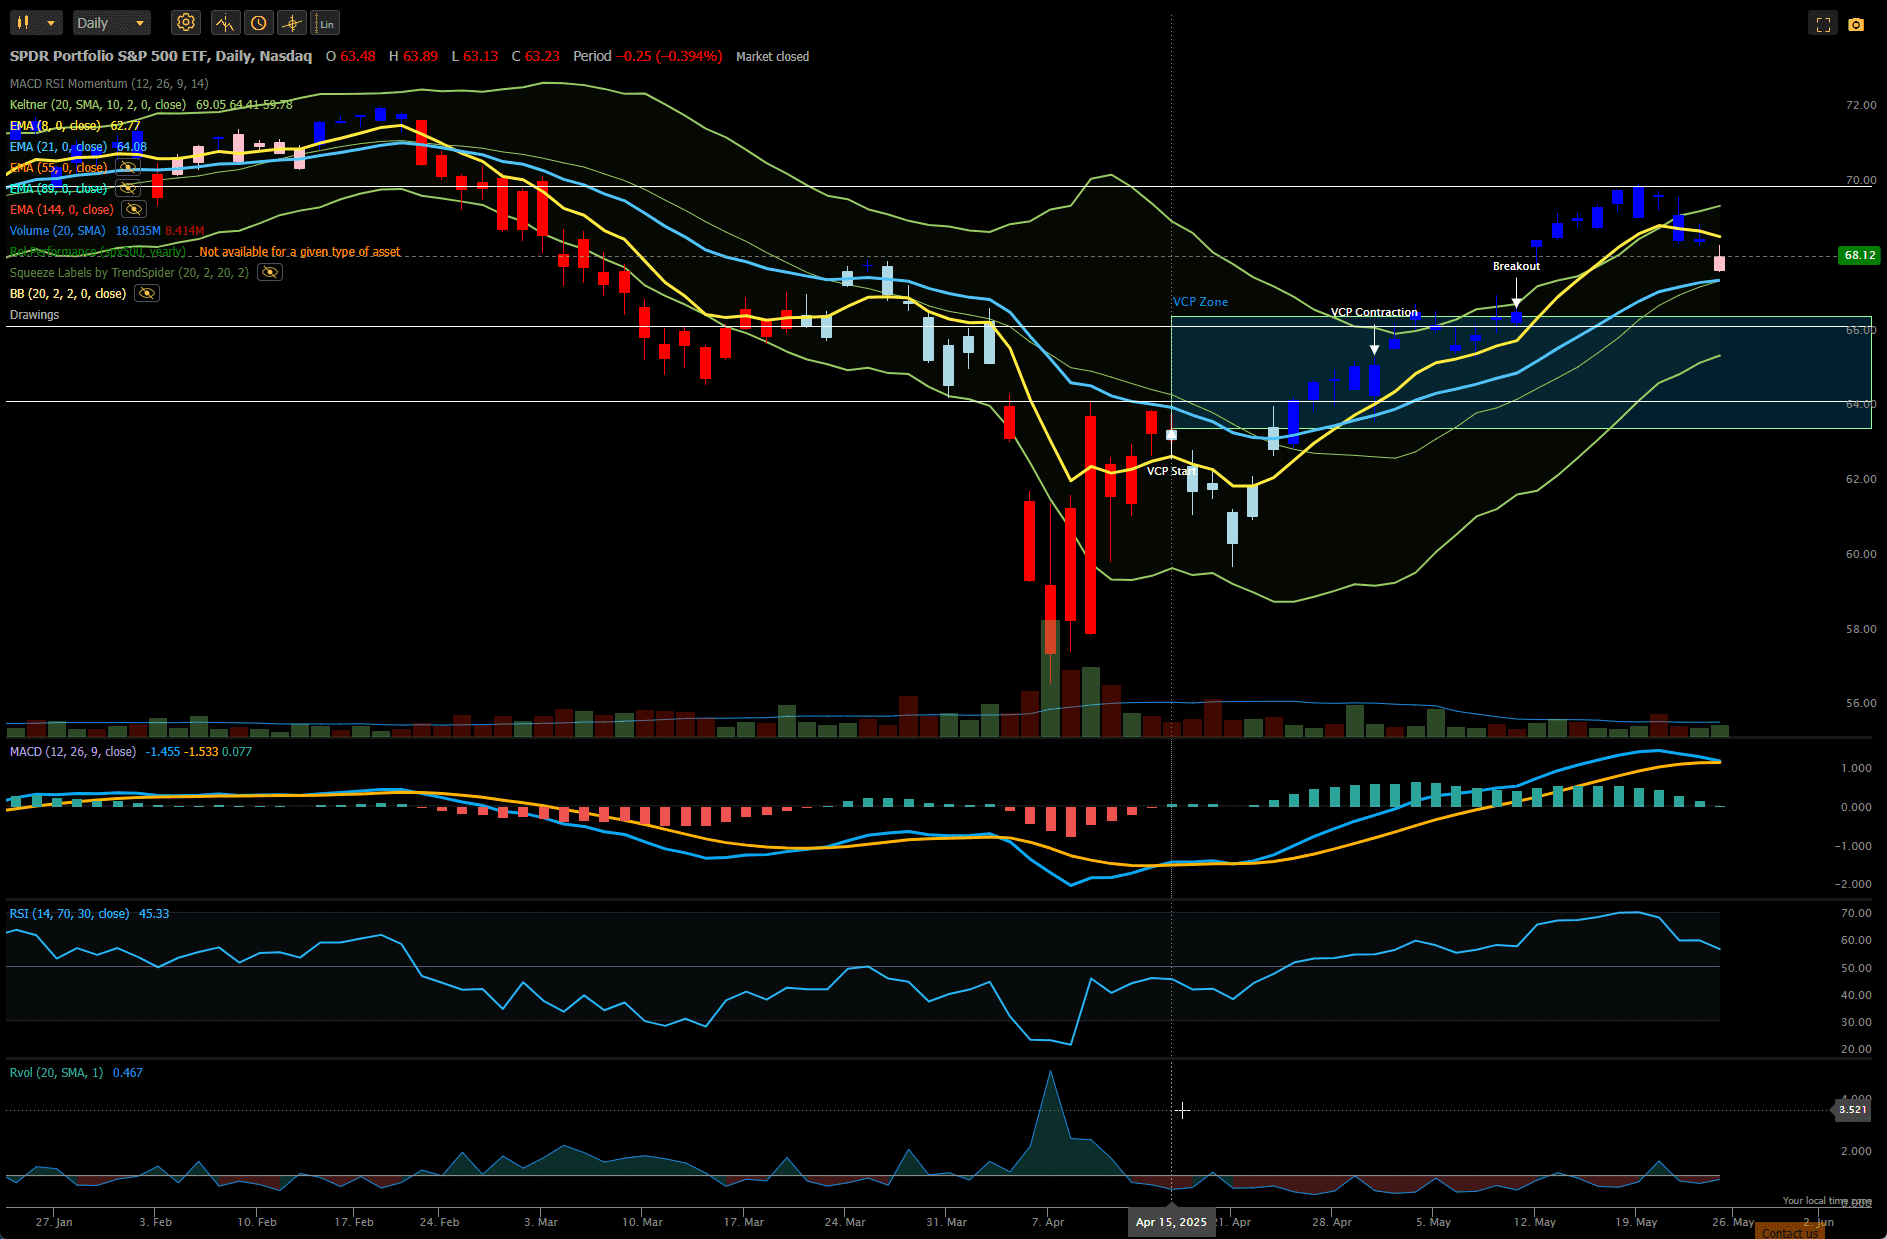
I won’t clutter the blog with all the details, but, on Friday, I also sold Call Options (expiring 20 June) against my holdings in SPLG (sold 1 x $70 Call at 0.60), EEM (sold 2 x 46 Calls at 0.75) and ETA (sold 2 x $89 Calls at 0.60). The case for doing this was not as strong as for VNQ, with these ETFs retaining their Buy recommendation, although US equities (SPLG) did weaken a little – but not to the extent of triggering an 8-day/21-day EMA cross. Confirmatory signals were mixed with MACD turning bearish and RSI weakening but not signaling bearish just yet:
 Selling Call Options against the above 4 ETFs generated a total of $390 in credits. If ETF prices stay at the same level (or below the strike prices of the Options sold) between now and 20 June that $390 credit would be considered “income” over and above the equity value of the assets held in the portfolio – similar to a monthly divided. Even at this level (only 60% invested) that’s ~5% annualized and additional “alpha” value to the portfolio.
It also provides a weak “hedge” against lower prices but, of course, it doesn’t offer significant protection against a strong pullback/correction, So, let’s look at how we might measure the level of protection and what other options might be available to us when managing risk.
Portfolio Hedging
This is, unfortunately, where things get a little complicated – at least in the understanding if not, necessarily, in the final application.
By selling Calls in 4 of the ETFs currently held in the portfolio we have reduced risk to some degree – but how much and how do we measure it?
When we select the assets that we will put into our portfolio “quiver” we consider diversity and the correlation of the assets in the quiver. The first step then, is to choose an index that correlates closely with a portfolio of shares composing the composition of the assets in our “quiver”:
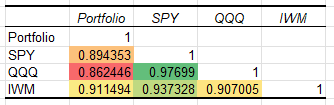 The above screenshot suggests that, of the chosen indices, the Rutherford-Darwin portfolio correlates best, ~91%, with IWM – although correlation with SPY and QQQ is also high and would probably be equally acceptable.
We then need to look at the relationship between each individual ETF and the index. We do this by calculating the Beta of the ETF relative to the index. In the second column (green background) of the Kipling worksheet shown in the second screenshot above I show the “Beta” of each asset relative to the IWM ETF that tracks the Russell 2000 Index.
The next step is to calculate how much “exposure” we have in the assets held relative to the index:
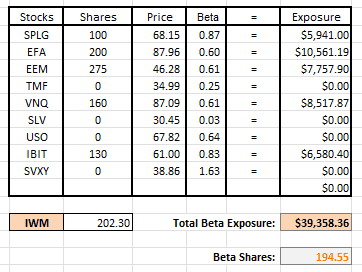 In the above screenshot I have taken the number of shares held, and their price, and multiplied this by the Beta relative to IWM. Most of the Beta values are less than one (1) suggesting that the core Darwin portfolio should be less volatile and risky relative to IWM. My total Beta exposure, in the above example, is $39,358 or the equivalent of holding 195 shares of IWM at $202 per share.
If, instead of hedging each ETF separately, I wanted to hedge my total holdings, I could just find an Option position in IWM that would do this. The simplest way to do so might be to buy a suitable Out-of-The-Money (OTM) Put Option – this would provide protection at an acceptable level (balancing the insurance cost against the risk) – but I won’t get into those details here – maybe if/when an opportunity arises as we follow the progress of this new portfolio.
At the beginning of this post I suggested that the Call Options that we sold provide a “weak” hedge to our portfolio, in addition to the fact that they have the potential to generate “income”. Let’s take a look at what I mean here – and this requires a little education in Options, and the Option “Greeks” – specifically “Delta”.
Options are available for exercise at different strike prices and expiration dates and are characterized by several parameters (the “Greeks”) that reflect how they behave. “Delta” is the simplest of these and simply reflects how much the Option will move in Price for each Dollar ($) move in the underlying asset.
We’ll take the example of the $90 Call Options in VNQ, expiring 20 June, that I sold at 0.06 ($60 credit) as I described above. At the time of the sale, these Options had a “Delta” of ~0.24 meaning that the value of the option would change by $0.24 for every $1 move in VNQ. Since I sold Options, I would benefit if the price of VNQ declined (hence the value as a hedge) – but of course I only benefit to the tune of $0.24 as VNQ declines by $1 – or $24 on the 100 shares covered – so it mitigates my losses a little but does not provide strong protection. In addition, VNQ’s Beta, relative to IWM, is only 0.61 (above screenshot), so in terms of protecting a portfolio equivalent to holding 195 shares of IWM I am only protecting ~24 x 0.61 or ~15 shares or ~7.5% of my portfolio.
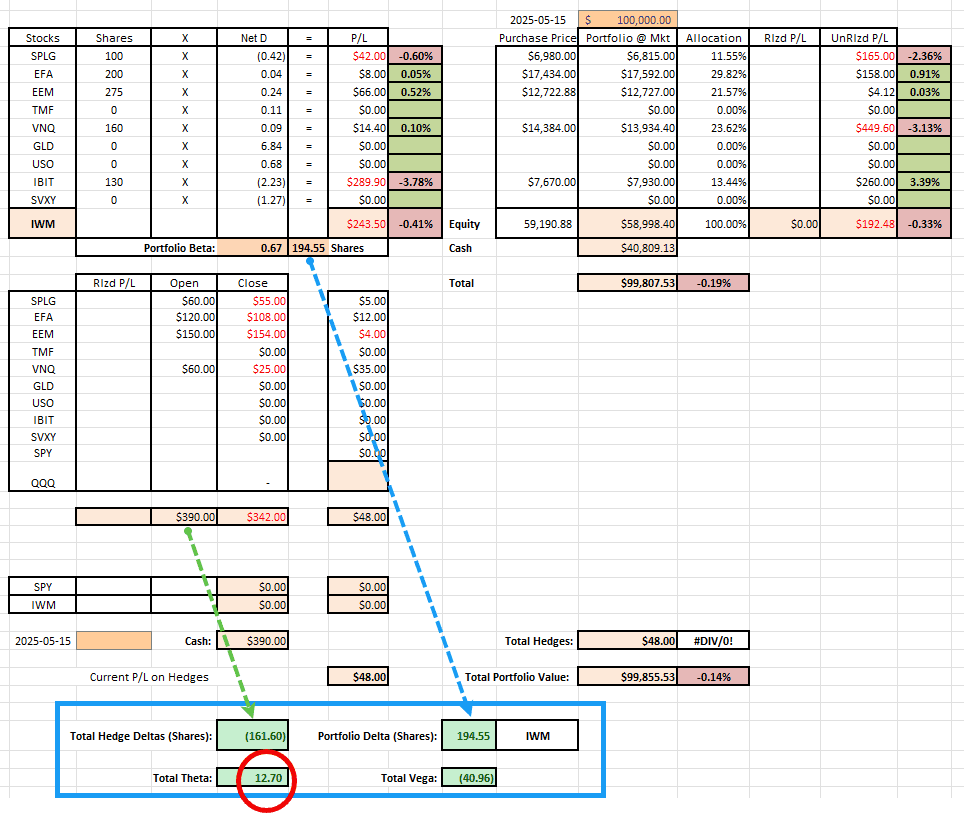 The above screenshot (in the blue box) shows the 195 share IWM equivalent of the portfolio holdings and ~162 share equivalent of the protection afforded by the sale of the Call Options. So there is ~80% short-term coverage. Of course, this situation is not static (hence the monitoring spreadsheet) and does not allow for catastrophic price changes.
Selling Options enables the decay of time premium and, in the above example, we see a “Total Theta” from the sale of the Call Options of 12.70 – meaning that we earn $12.70 per day in time premium decay. Again, this is not static and accelerates approaching expiration – assuming no price movement. This is where the “income” value comes from. However, this “income” can also be used to buy “insurance” against more significant pullbacks and corrections and to manage the level of portfolio drawdowns. In this Portfolio Management Plan I intend to sell Call Options to generate “income” and/or to finance the purchase of portfolio insurance. I will describe ways in which the stronger portfolio protection might be achieved when the real-time conditions indicate that this might be prudent/necessary.
This is a lot to absorb – and probably very confusing at this point. Hopefully, it will be a little easier to understand as I implement some of the strategies going forward and provide a little more information in the context of changing market conditions. I obviously don’t expect many, or even any, readers of this blog to adopt all the strategies that I’ve outlined in this series of posts. However, I hope readers will find educational value in reading a little about some of the strategies that can be employed for portfolio construction and portfolio management and, maybe, that some readers may choose to include one or two of the ideas into their own Plans. As usual, please feel free to ask for clarifications in the comments section below – in the interests of keeping this post as short as possible I have not gone into a lot of detail/explanation – only provided an outline.
Discover more from ITA Wealth Management
Subscribe to get the latest posts sent to your email.
Leave a Comment or Question