
Virginia Barn Scene
This update of the Franklin will be short as only one change is in the offing and that has to do with a single sector (VHT). More on this later. The first thing I did before starting this review was to update all the sector Bullish Percent Indicators (BPI). A complete BPI post will go up on this site tomorrow if not this afternoon. I need to make sure StockCharts has updated all their Point and Figure (PnF) graphs for the week.
Franklin Security Holdings
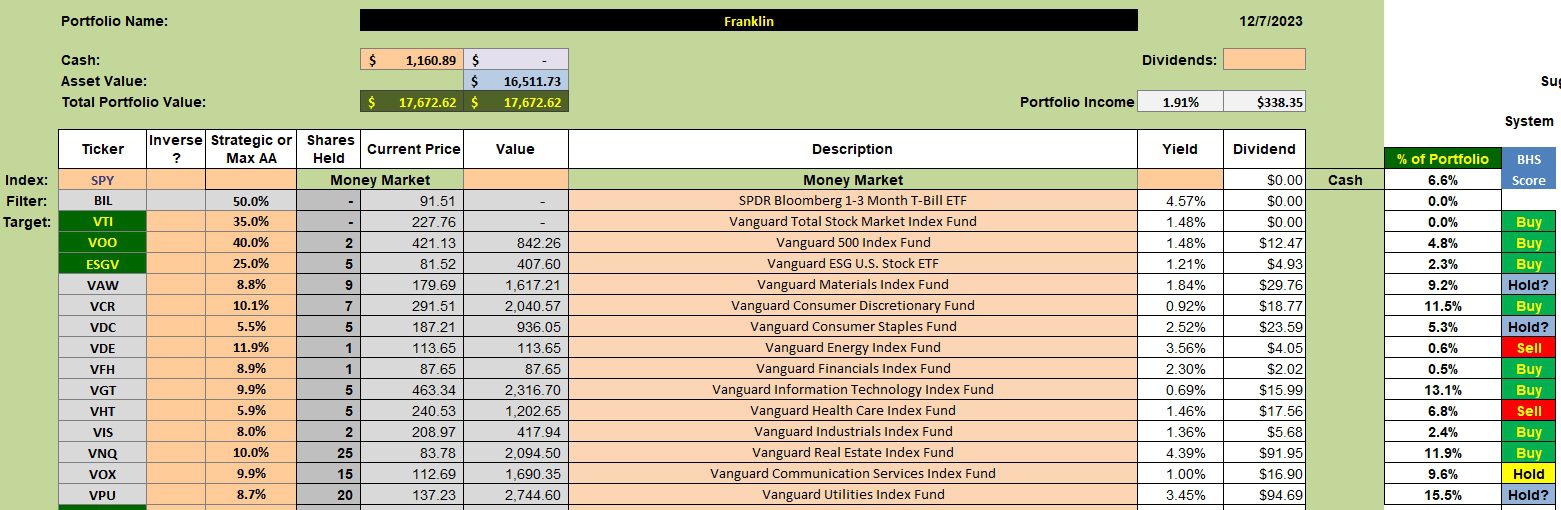
Below are the current holdings for the Franklin. This is a small portfolio, but the account is managed similar to larger portfolios using the Sector BPI investing model.
When I updated the BPI data this morning, Health (VHT) was within a whisker of reaching the overbought zone so I set a 3% TSLO on the VHT ticker.
Franklin Performance Data
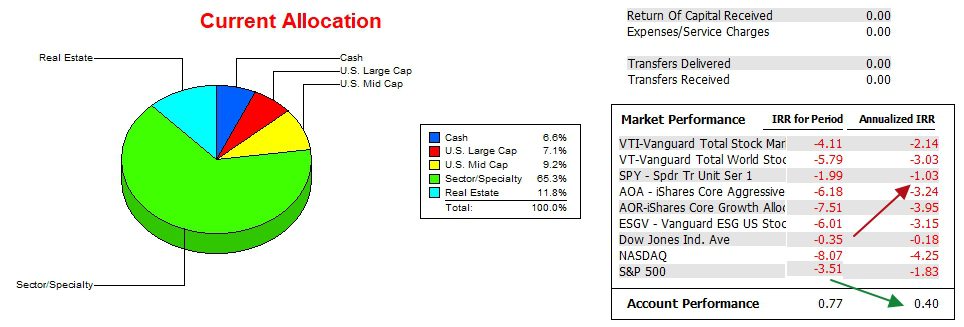
A strong market over the past six weeks nudged the Franklin into positive territory. This data is 23.5 months in duration and the IRR for the portfolio continues to edge out the SPY benchmark. In the following data I also included three major indexes, shown at the bottom of the Market Performance column.
Franklin Risk Ratios
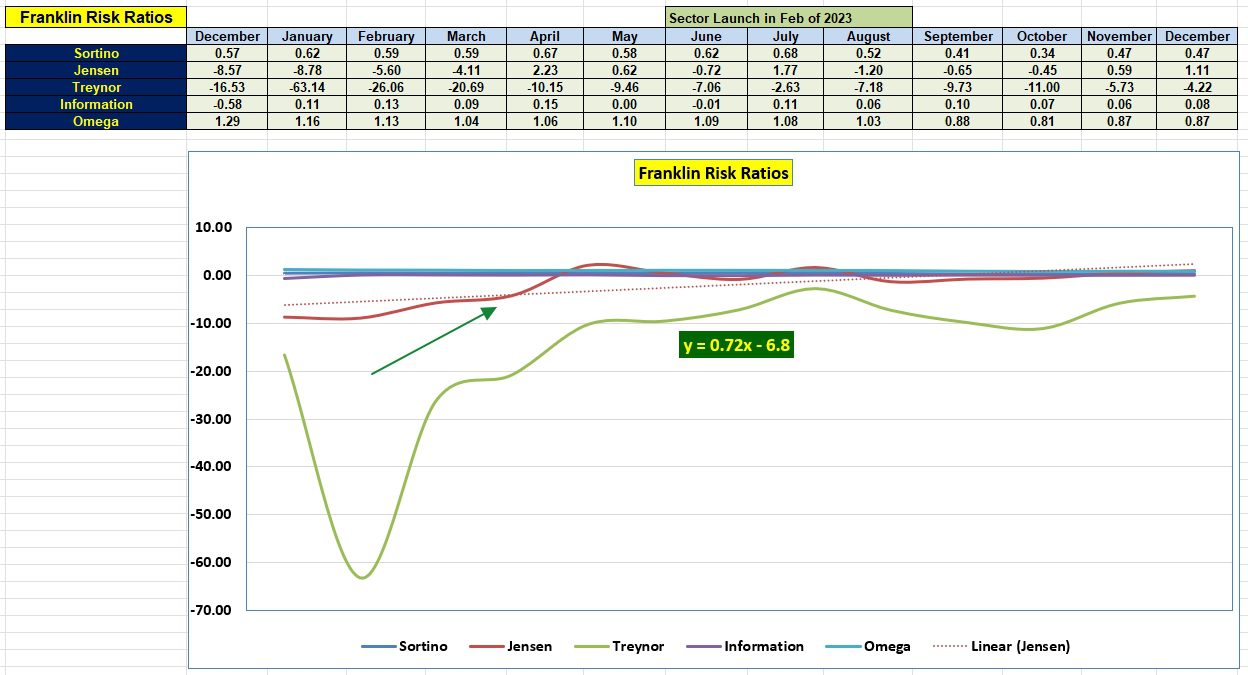
The following risk data table shows several positive signals for the Franklin.
- The Jensen graph is positive.
- Since last September the Information Ratio improved.
- The Sortino Ratio is holding steady.
- With few exceptions, the Jensen Alpha or Jensen Performance Index is improving.
Tweaking Sector BPI Plus Investing Model: Part II
Franklin Portfolio Review: 21 July 2023
Discover more from ITA Wealth Management
Subscribe to get the latest posts sent to your email.
Lowell,
I’m not rounding off sticking to the cross on/over parameter. Eventually I’ll try to evaluate whether it matters. It probably just leads to less trading.
Bob W.
Bob,
So far I’ve only set the TSLO for this single portfolio.
Lowell