
Fall in Oregon
Carson is the Sector BPI portfolio up for review this morning. Carson is the oldest Sector BPI portfolio with two years of data which is still a very short period to come to any significant conclusions as to the viability of any investing model. Thus far the model looks strong, but the Sector BPI model is still in the hypothesis stage of development. There is no reliable way to back test this model do to proprietary Bullish Percent Indicator settings as well as variations as to when Trailing Stop Loss Orders are set. There are too many variables making back-testing close to impossible to duplicate.
For the sake of new readers, several investing models are used here at ITA. Hedgehunter tracks different portfolios and uses different models. Of those I follow my favorites are the Schrodinger and Copernicus. The Schrodinger is managed by computer so the owner does nothing except save and add new cash to the portfolio. The Copernicus is for investors with a long horizon as investments are concentrated in U.S. Equities such as VOO and VTI.
Carson Sector BPI Securities
Below is the investment quiver and current holdings for the Carson. Energy (VDE) is the only sector holding as we wait for one of the other 10 sectors to drop into the oversold zone. As the market continues to rise this is unlikely to happen soon. While we wait for oversold events we invest available cash in VTI and VOO.
Limit orders are in place to purchase more shares of VTI and VOO with the available $5,000 in cash.

Carson Performance Data
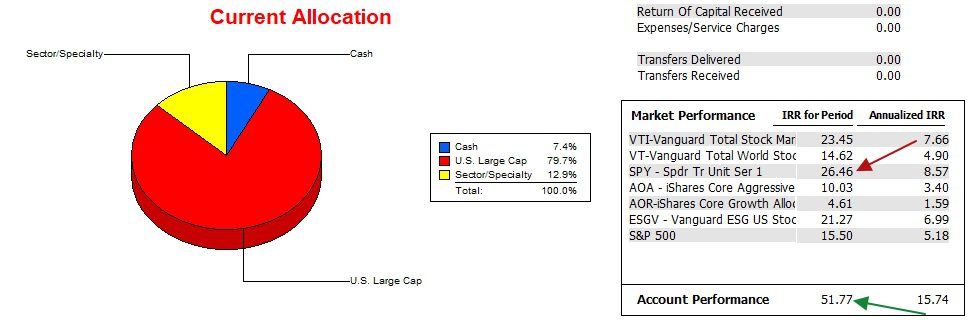
Since 12/31/2024 the Carson has outpaced the S&P 500 by a margin of nearly 2 to 1. Check the green and red arrows. The ratio is 3 to 1 if we look at the index itself. The advantage gap is even wider when we check other potential benchmarks. The IRR data bodes well for the Sector BPI model.
Carson Risk Ratios
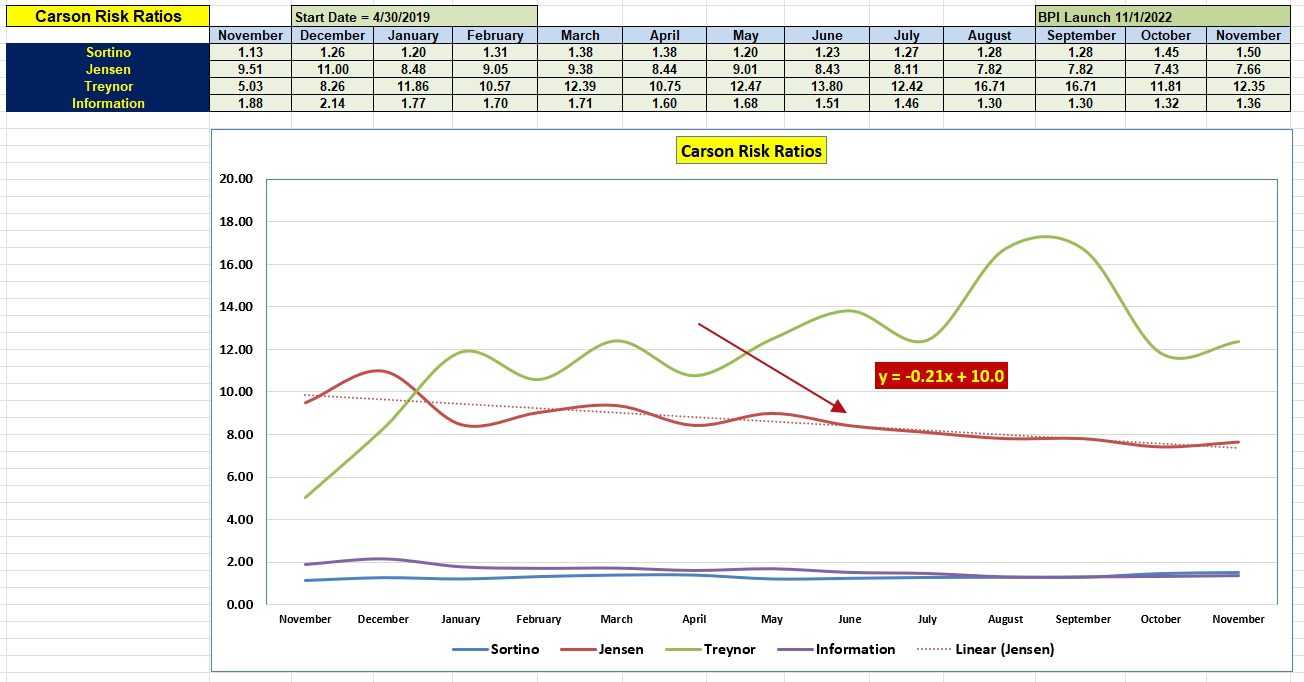
With such a strong market I don’t like to see the slope of the Jensen Alpha in decline. If you check the recent October and November data you will see the Jensen is at one of the low points for the entire year. The Sortino Ratio is increasing, one bright spot.
When values of the Jensen Performance Index are this high it is difficult to sustain these elevated positions.
Comments and Questions are always welcome. Share this blog with your family and friends if you think it is worthwhile.
Discover more from ITA Wealth Management
Subscribe to get the latest posts sent to your email.
You must be logged in to post a comment.