
It’s That Time of the Year – Taking Boats out of the water at Bronte Harbour, Oakville, Ontario.
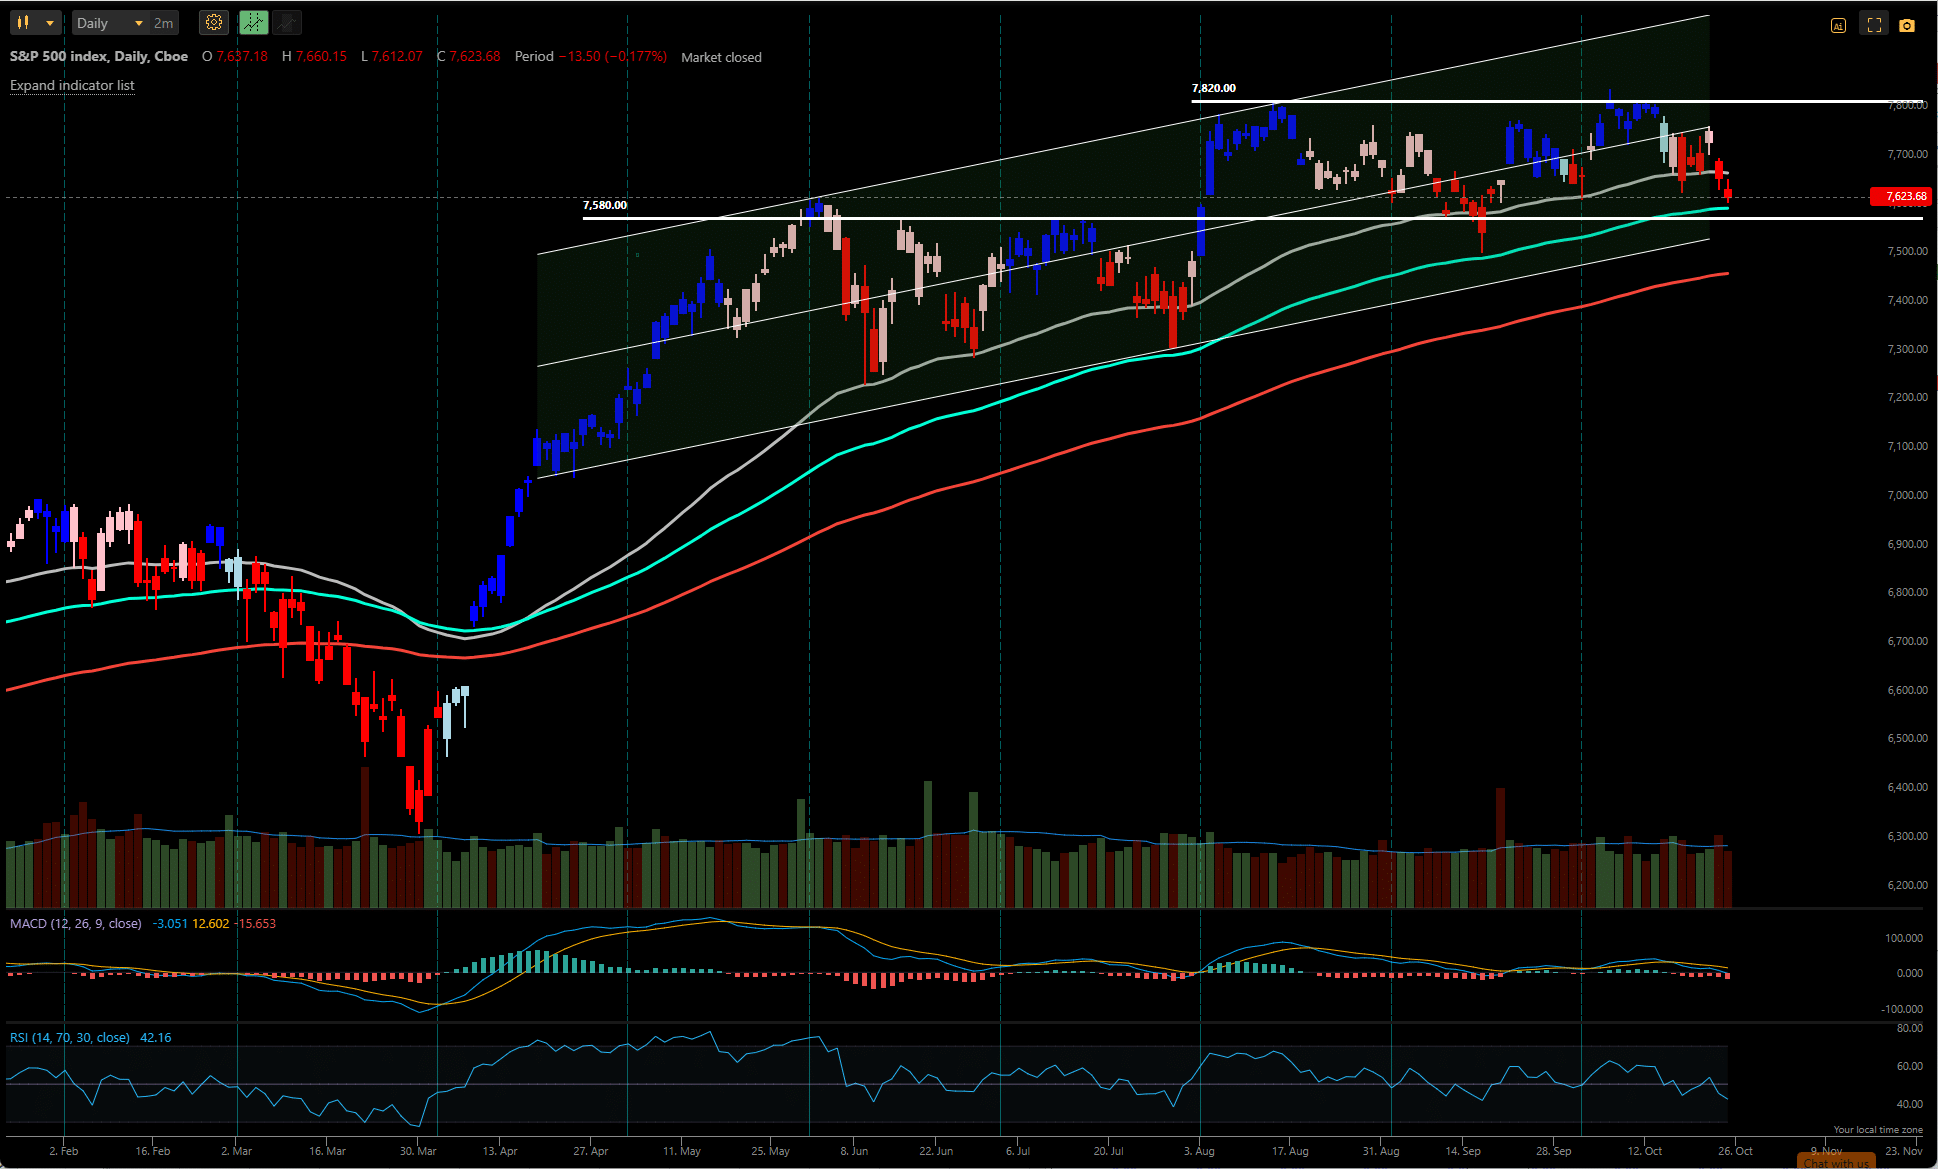
The broad US Equity market continues to consolidate in a narrow range – closing the week down ~0.4% from last week’s close:
 The rotation between sectors continues:
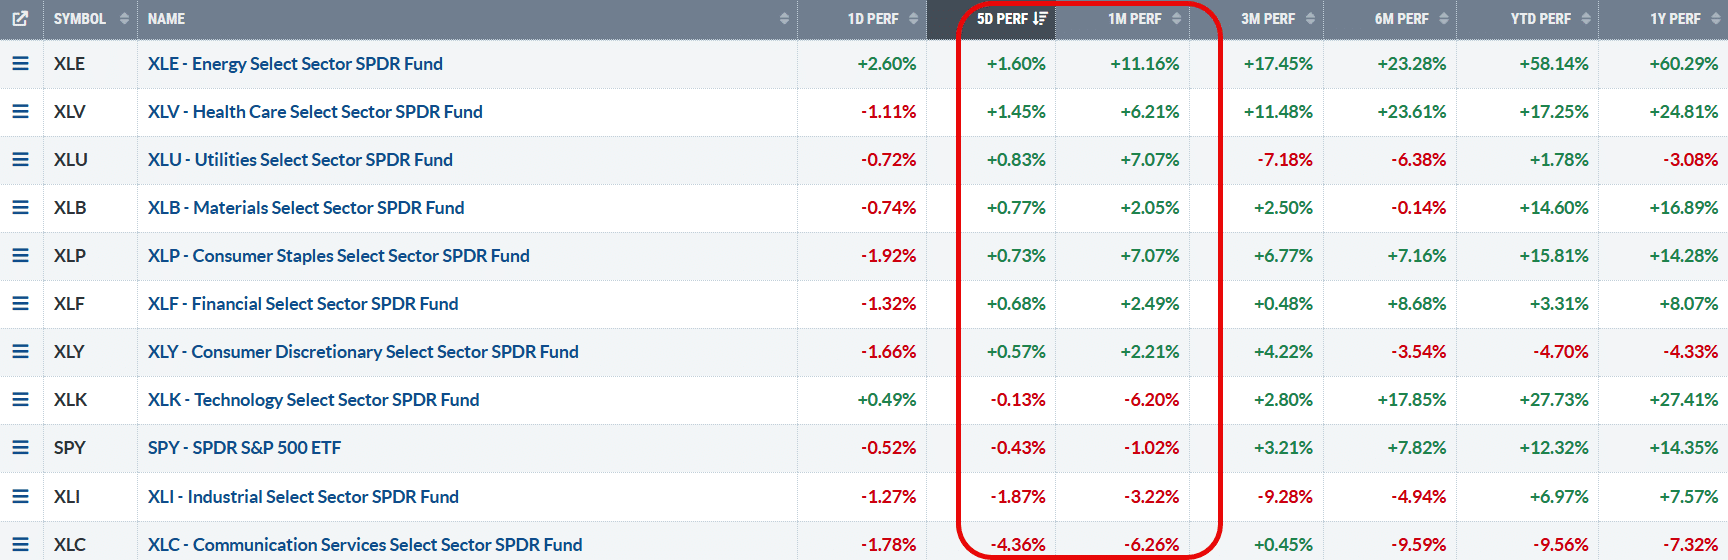 with technology fading slightly and more defensive sectors picking up the slack.
The current analysis sheet for the Darwin Portfolio looks like this:
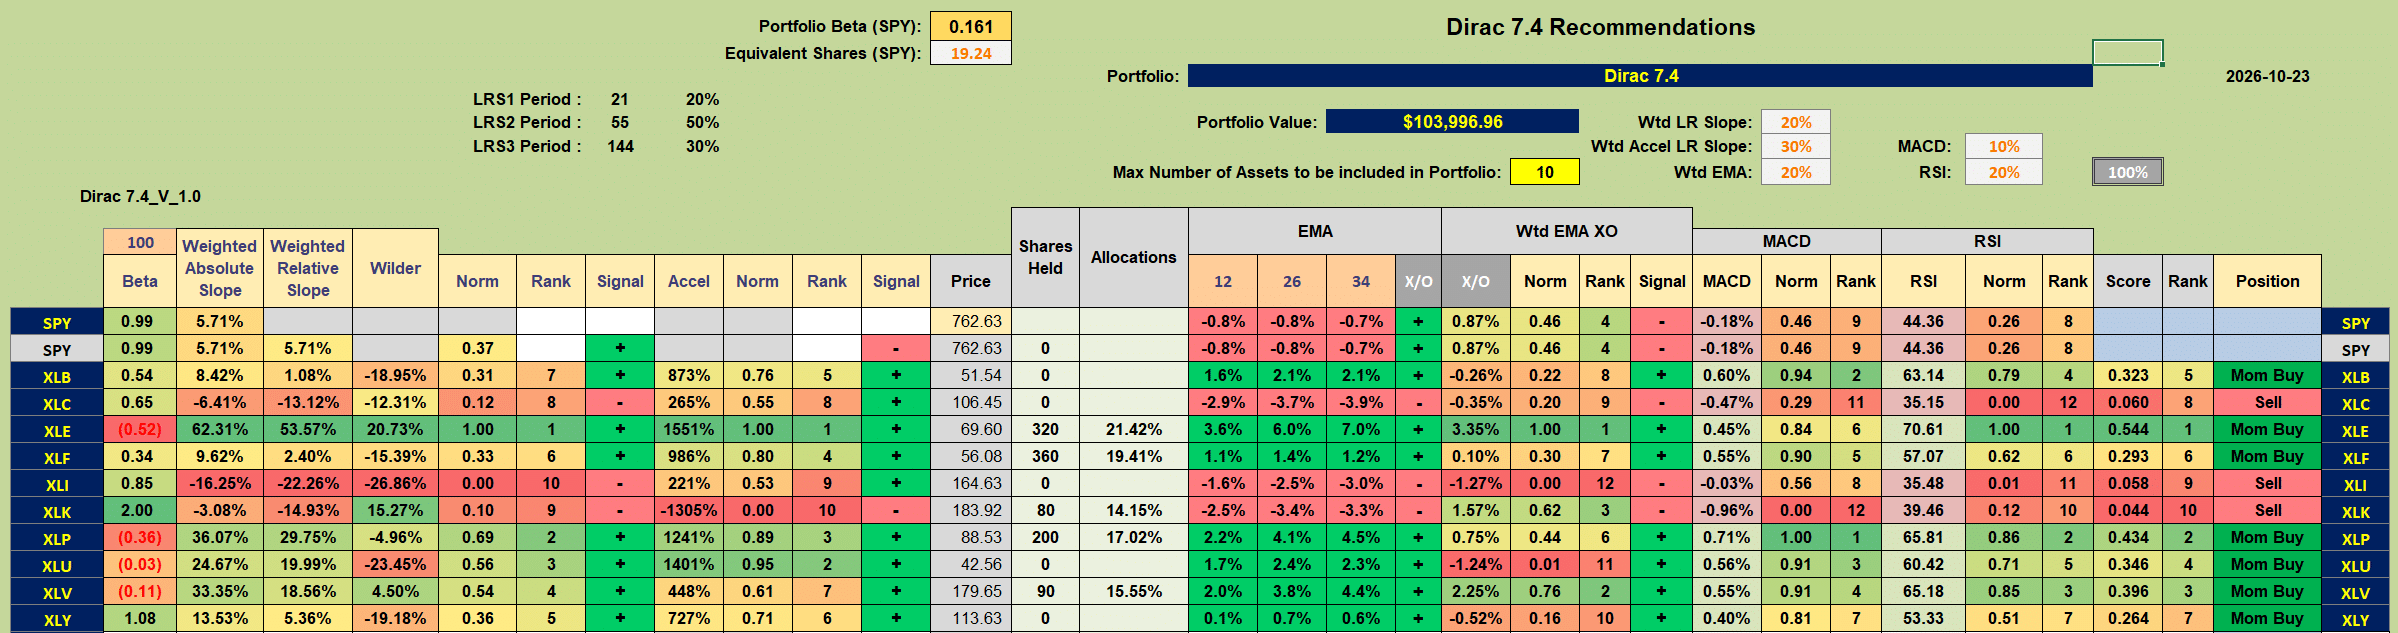 …. very much in line with the relative strength look in the above comparison table.
This has led me to the following adjustments in the past week (red box):
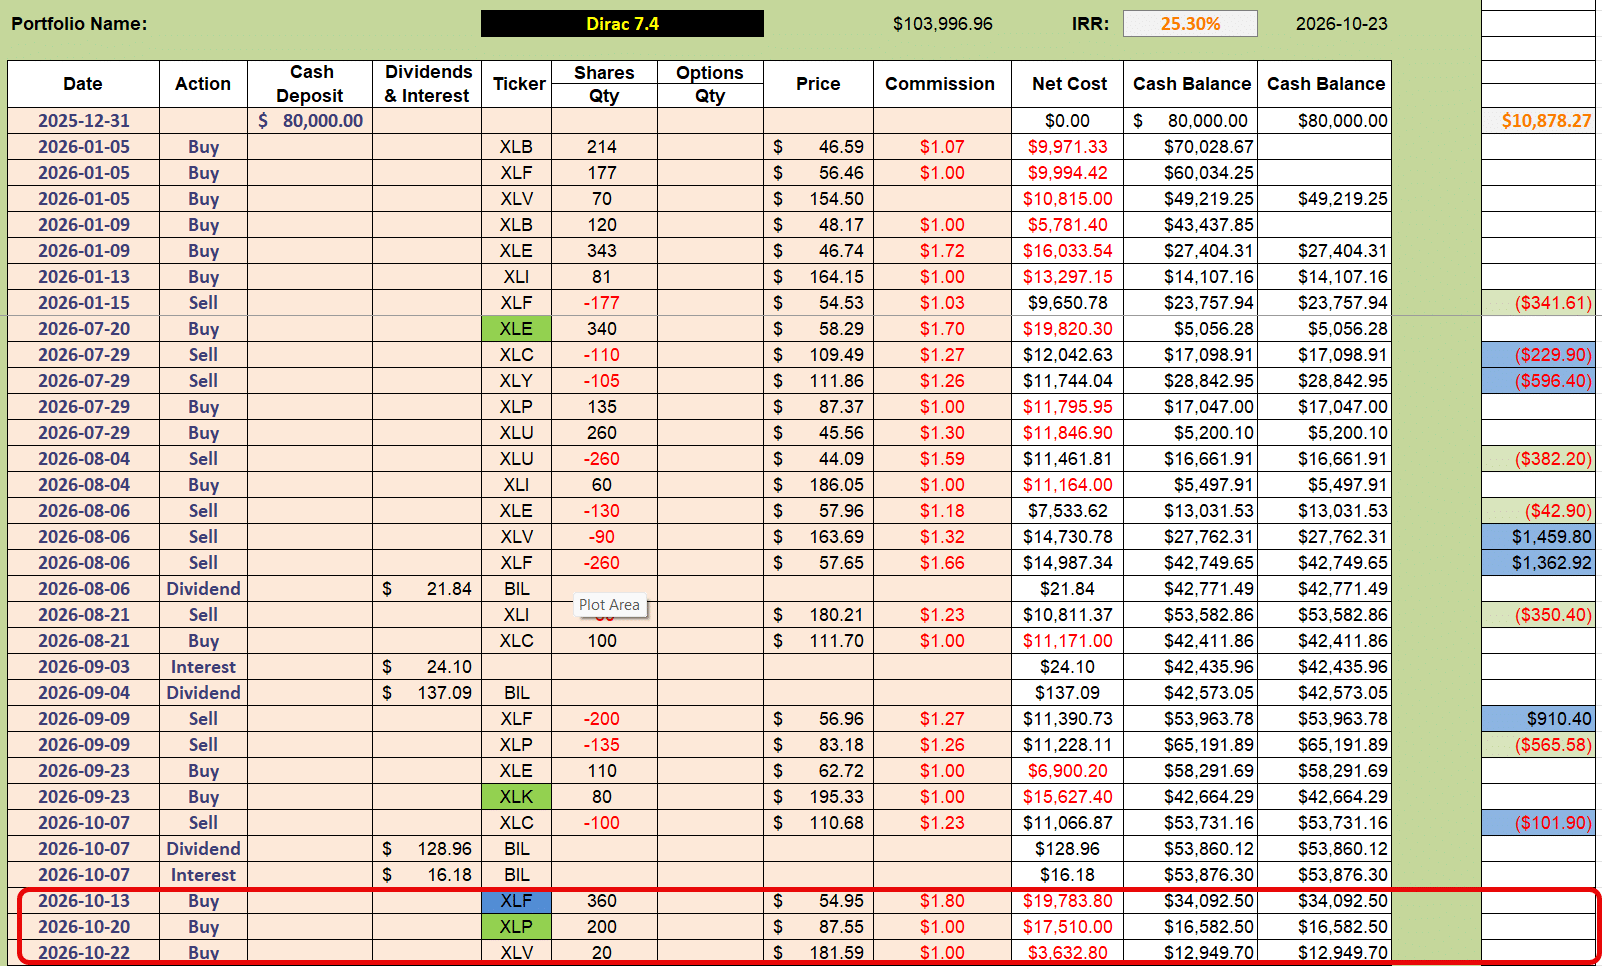 where I have added positions in XLF (Financials) and XLP (Consumer Staples) and a few additional shares in XLV (Health), to better balance allocations. I have not, however, sold my existing holdings in Technology (XLK), despite the Sell recommendation. Let’s take a look at why:
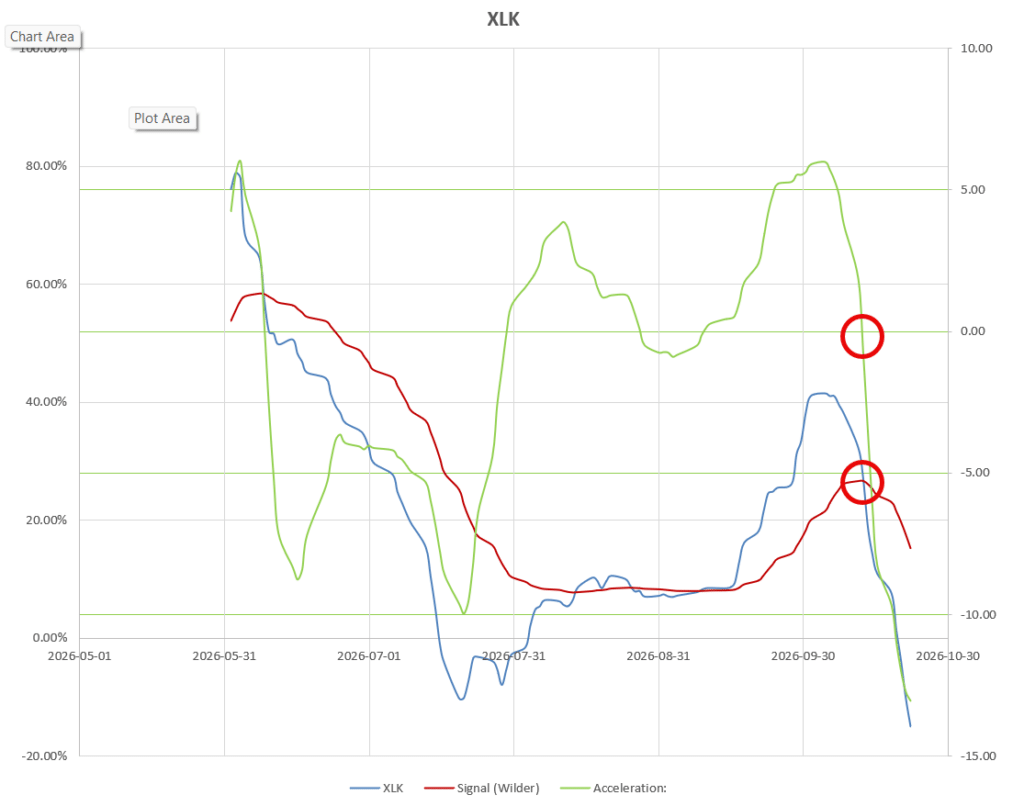 the Sell recommendation is generated from the momentum/acceleration graphs where momentum (blue line) has crossed below its 14-period Wilder Moving Average (brown line) and acceleration (green line) has dropped below zero and into negative territory. However, before making a decision I always check the price charts:
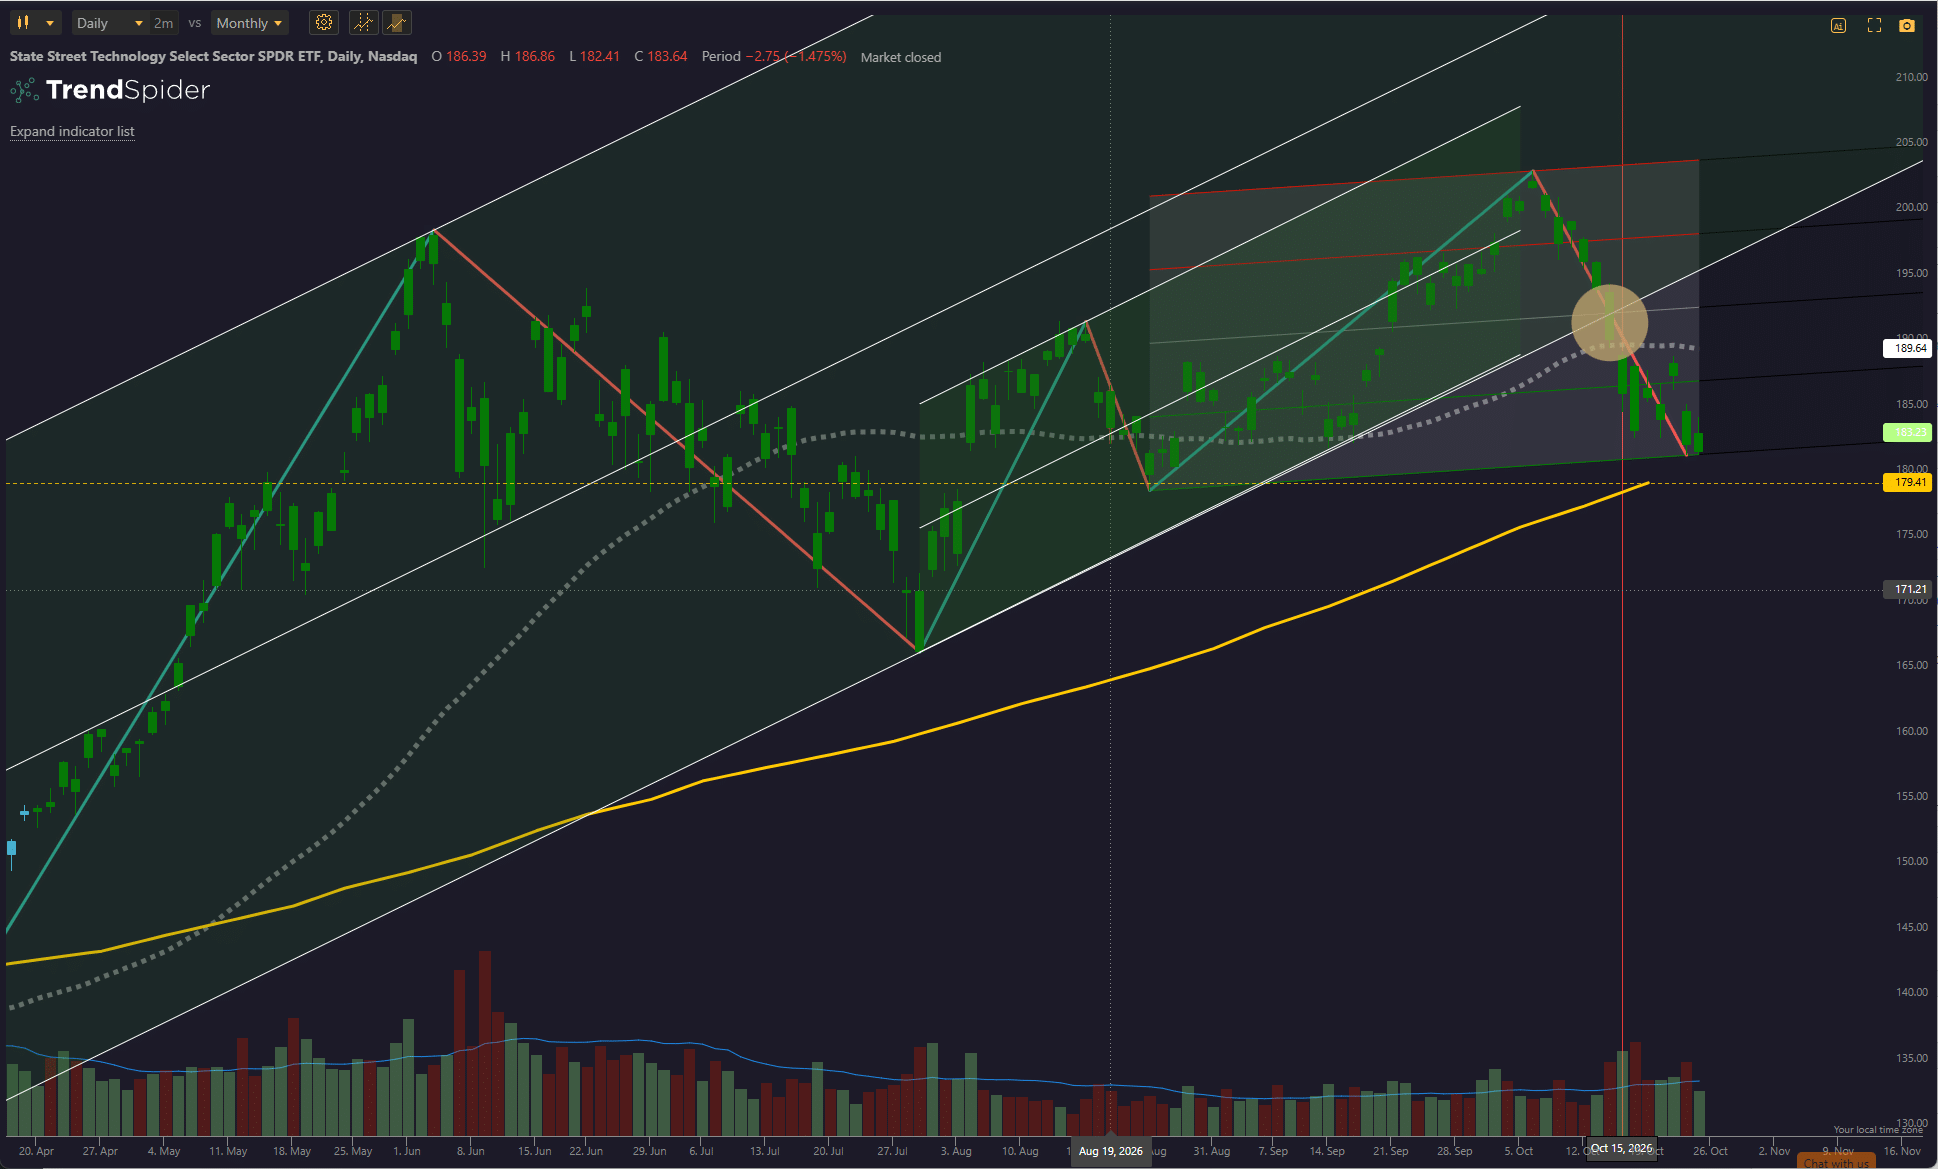 where we see that, although XLK has pulled back from its recent highs – the circle corresponds to where the momentum/acceleration Sell signal was generated – the candles are still colored green indicating that XLK is still in a Weinstein Stage 2 bullish trend and, although we have dropped slightly outside my selected bullish channel, we have not yet made new lows or crossed below the 30-week (150-day) Simple Moving Average (SMA) – yellow line. We are however below the 50-day SMA and close to the other potential support areas – so this needs watching. Once the green candles turn yellow (and autumn is coming) I will be selliing my shares in XLK. This is part of a test that I am doing to evaluate/clarify which momentum/acceleration signals might be worth taking early and which might need a little more breathing room. The objective here is to try to minimize the churn without missing opportunities.
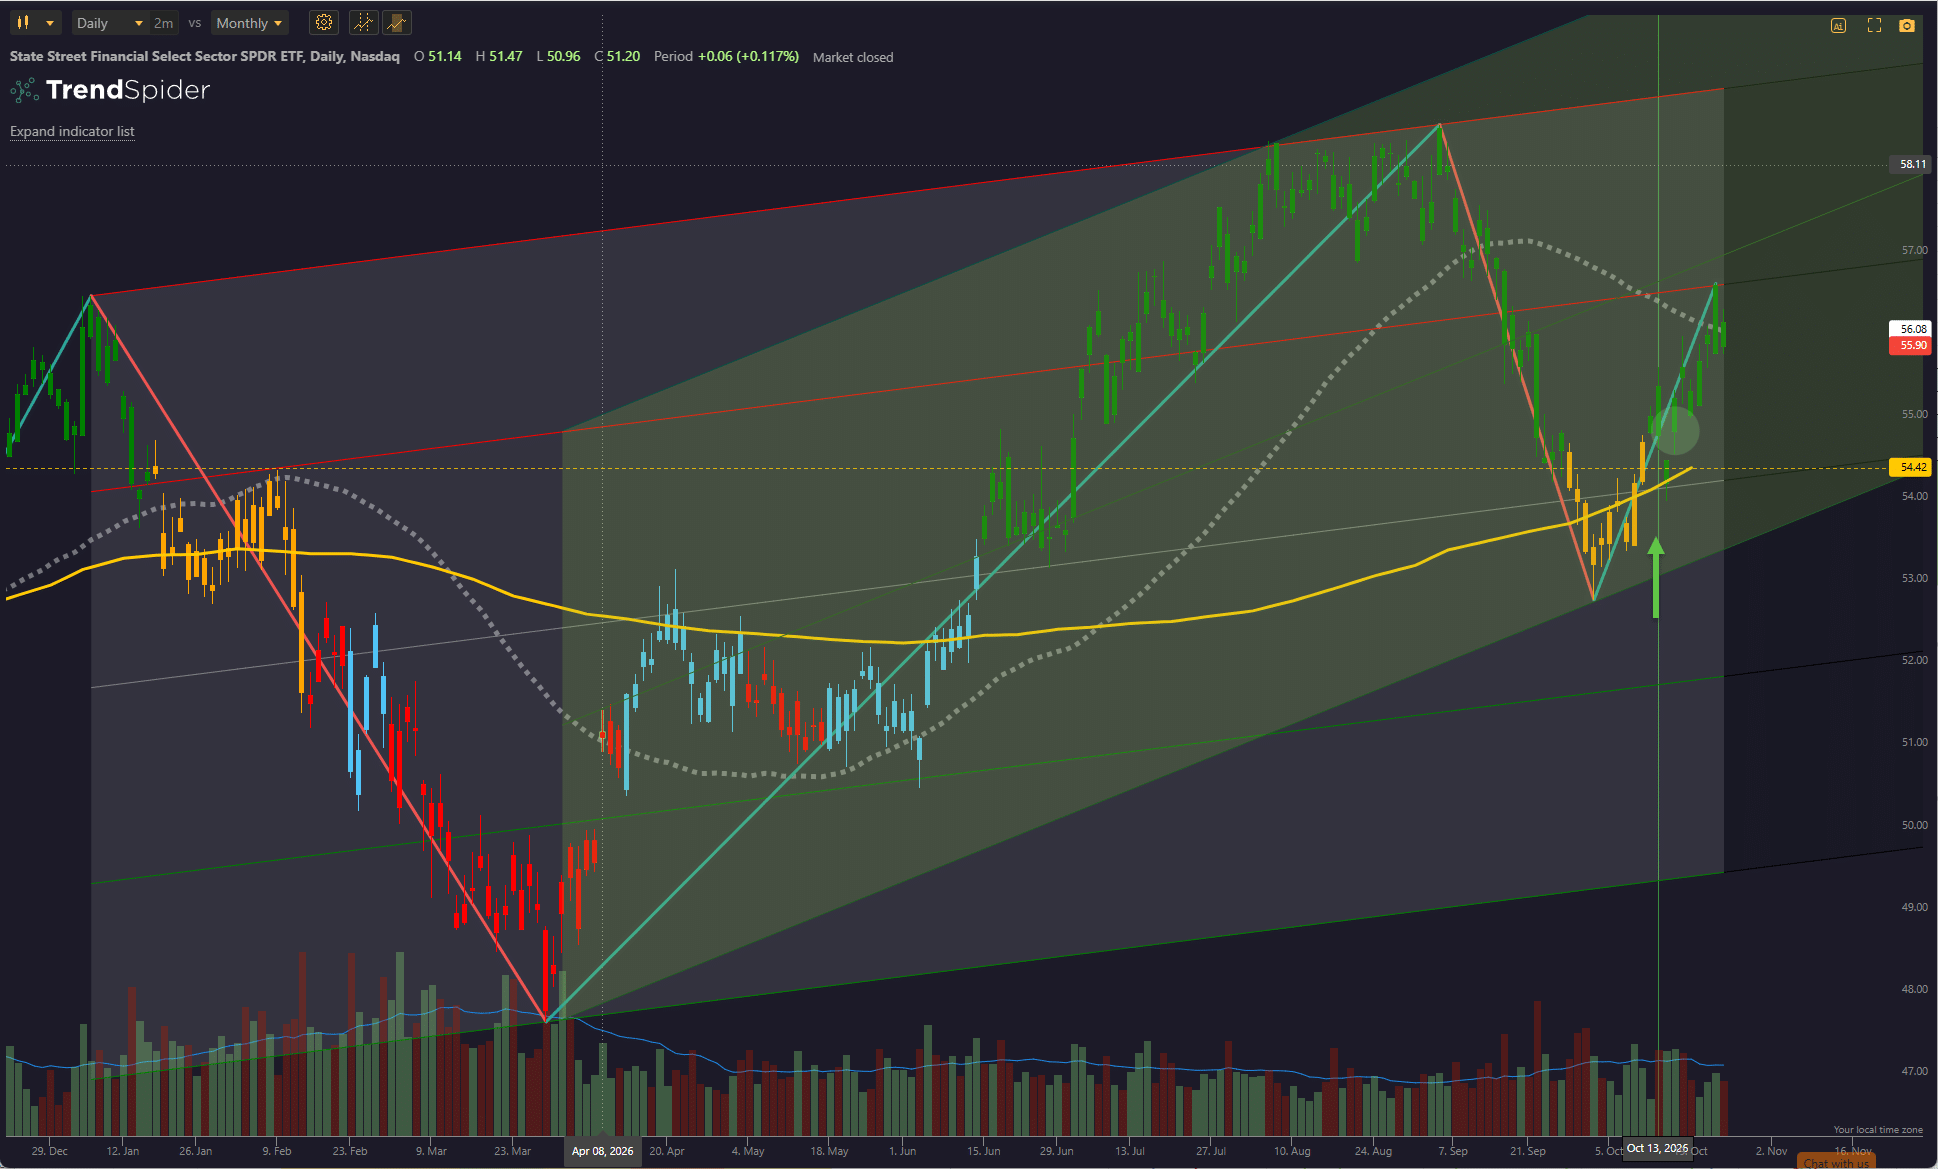
Let’s now look at the additions – at the last review I indicated that I had opened a position in XLF (Financials) based on the observation that XLF had just moved into a Weinstein Stage 2 regime (green arrow) even though the momentum/acceleration graphs had not yet sent positive signals. Banks had justed started to report earnings and these were looking positive – so I decided to jump the gun a little:
 2 days later (green circle) the momentum/acceleration graphs confirmed the suggestion (despite a scarry day in between):
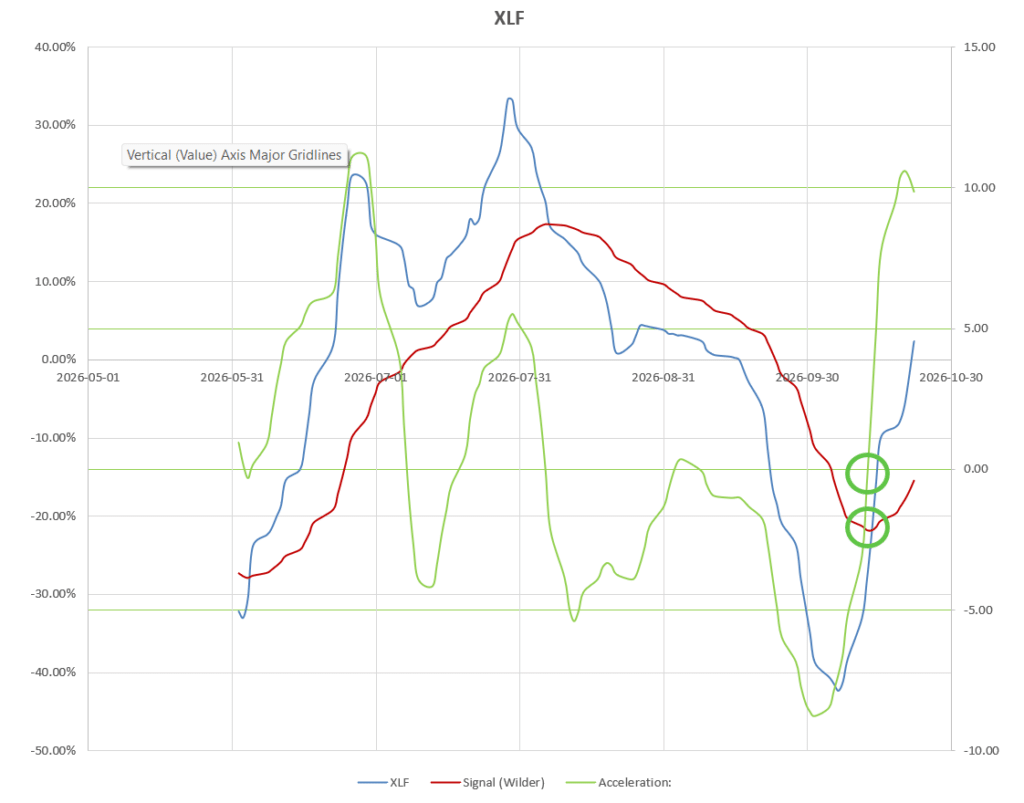
and now, the decision looks like a good one.
XLP also showed strong momentum and acceleration moves:
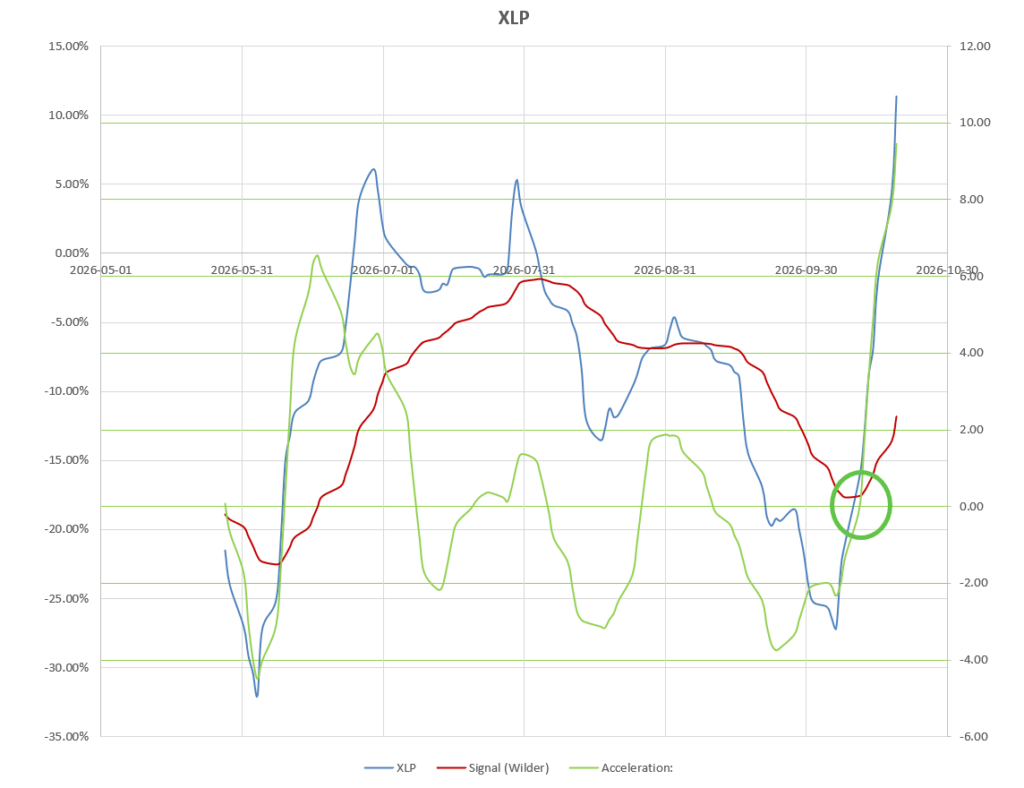 and these were confirmed in the price charts:
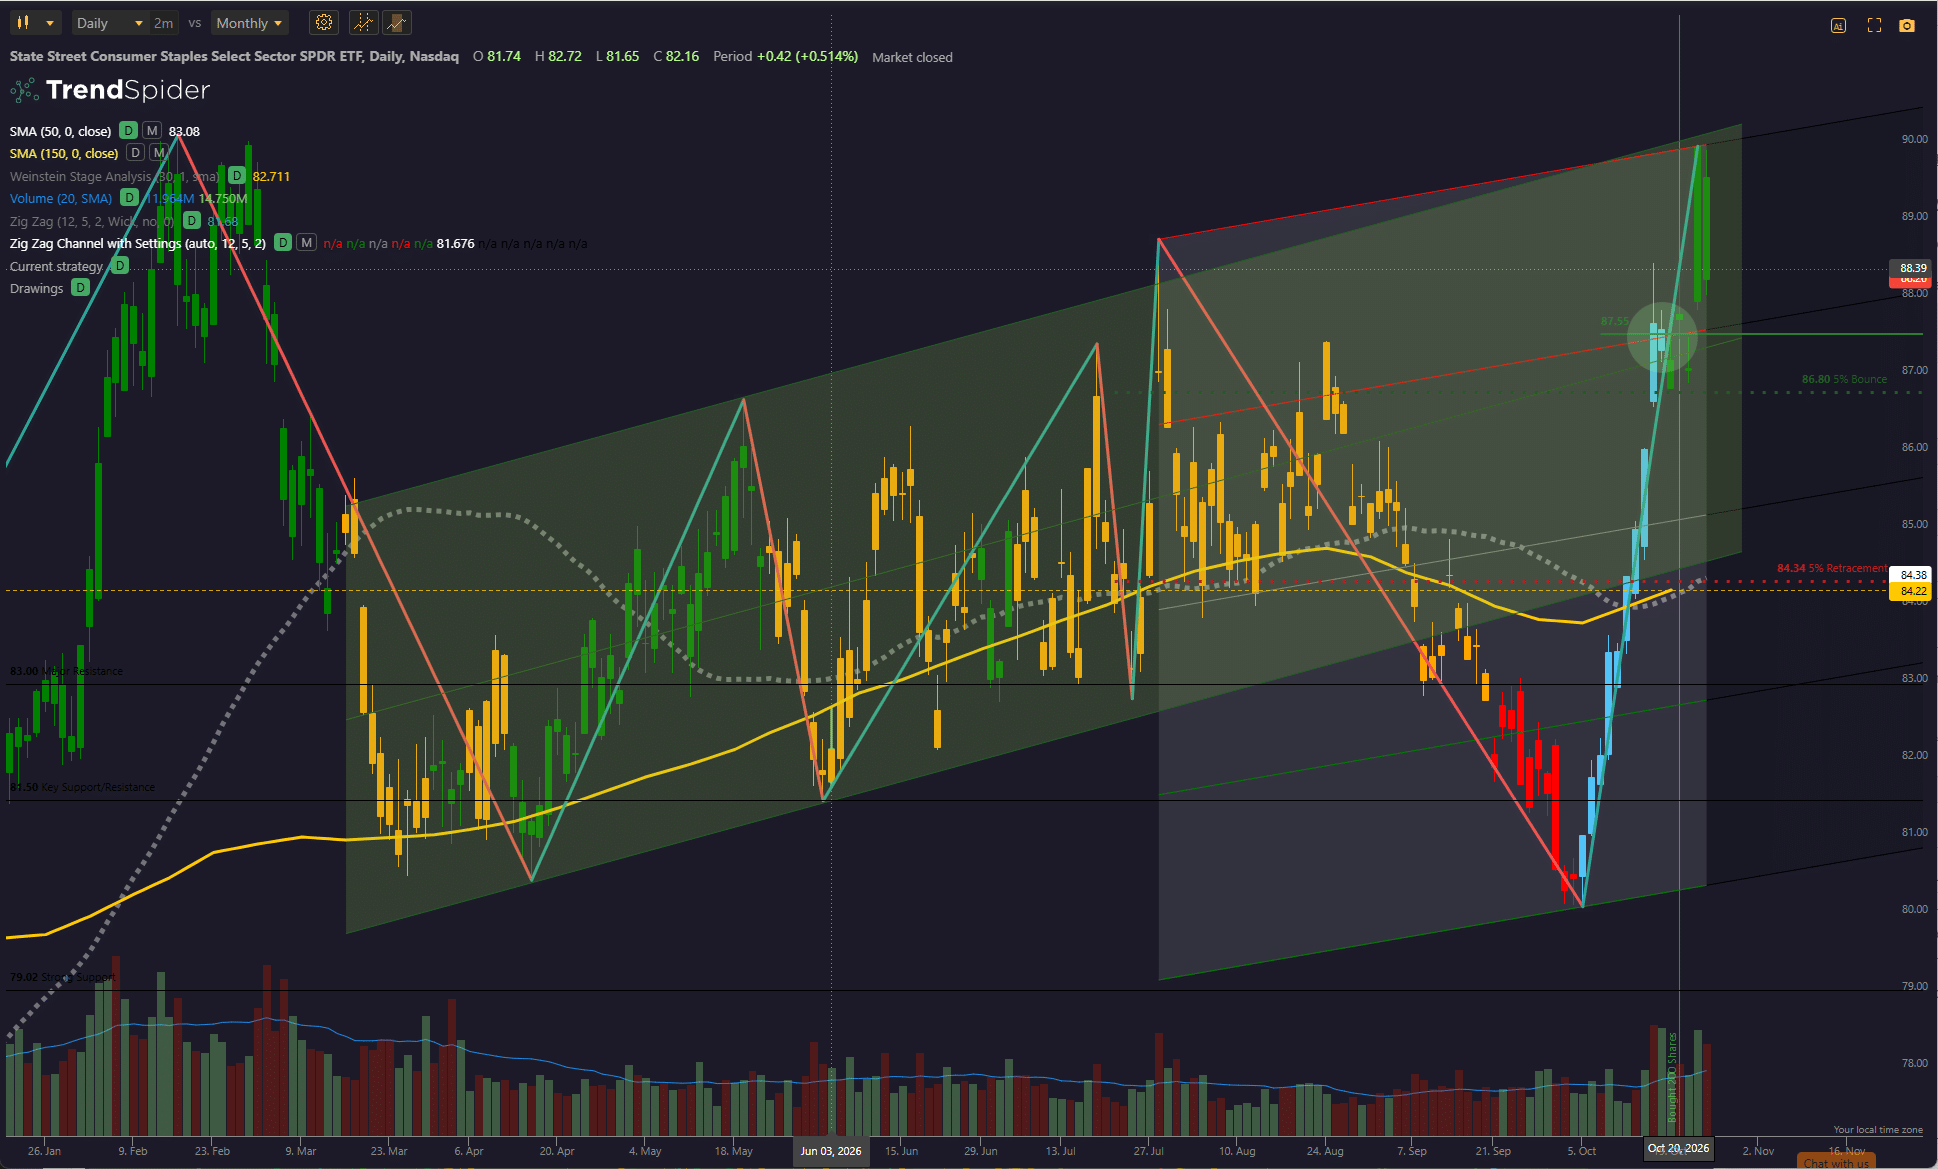 as XLP moved into Weinstein Stage 2 territory. 20 Shares of XLV were also added to the existing holdings in the portfolio to better balance allocations.
It is also interesting to take a look as to why I have not yet added positions in XLB (Materials), XLU (Utilities) and XLY (Consumer Discretionary) to the portfolio even though they are recommended Buys in the analysis sheet. The momentum/acceleration graphs for XLB look like this:
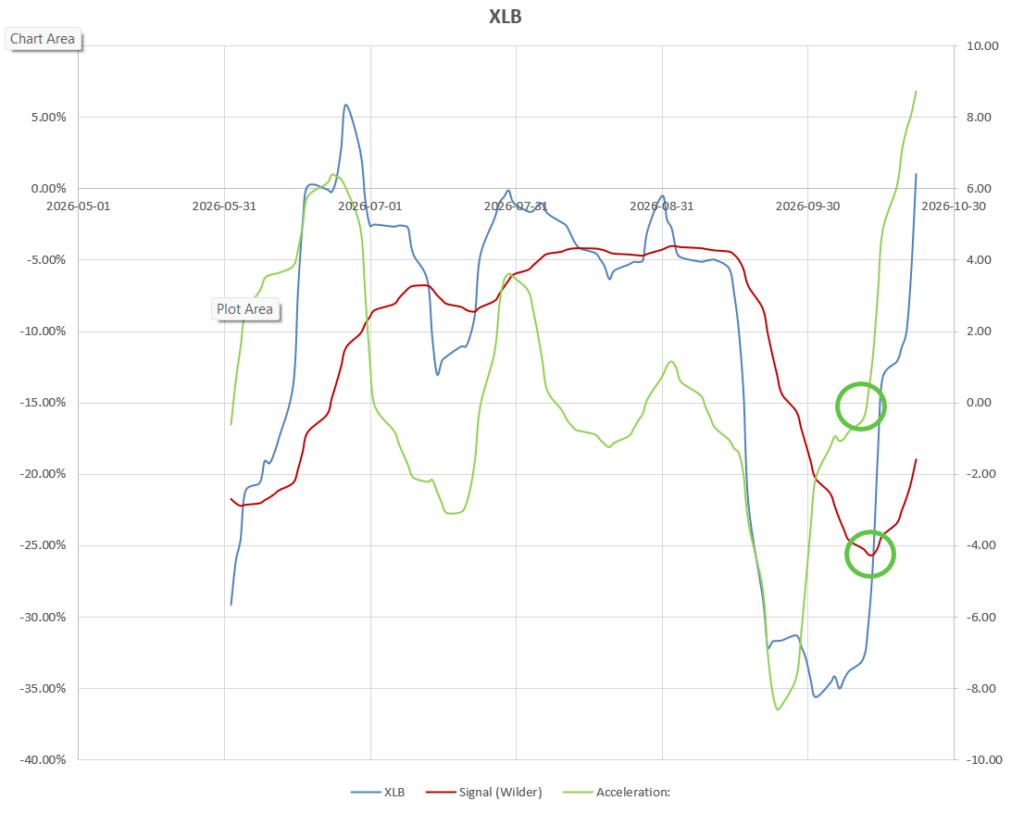 with two positive signals – but the price chart:
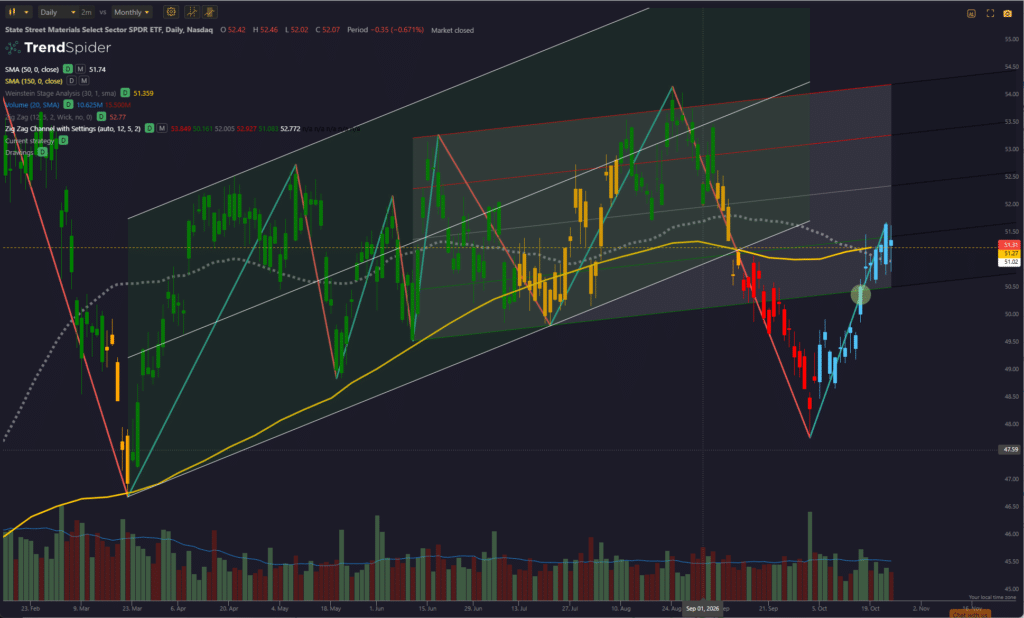 is showing XLB in a Weinstein Stage 1 (cosolidation) regime, and, although not strongly outside the uptrend channel, has recently pulled back into Stage 4 and made lower lows. The momentum/acceleration Buy signal is shown at the bar with a green circle. Price is presently sitting at both the 50-day and 150-day (30-week) Moving Averages so I will wait to see if we can move into Stage 2 before adding a position.
XLU momentum/acceleration looks like this:
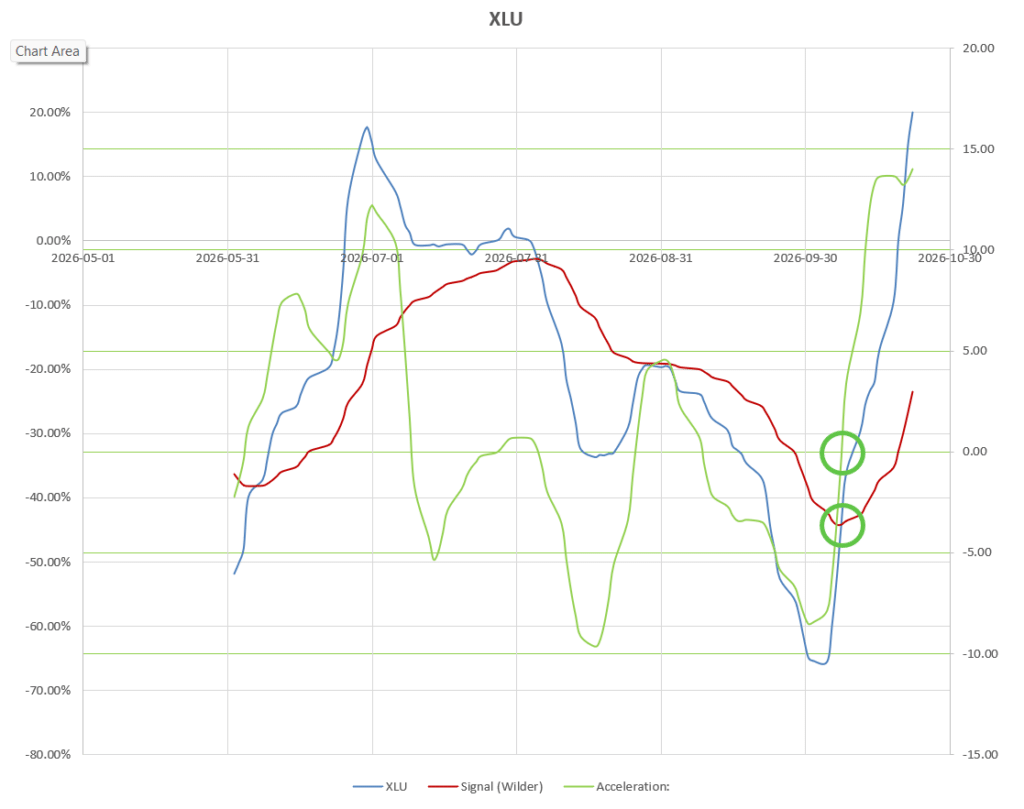 again with positive Buy signals, but with the price chart:
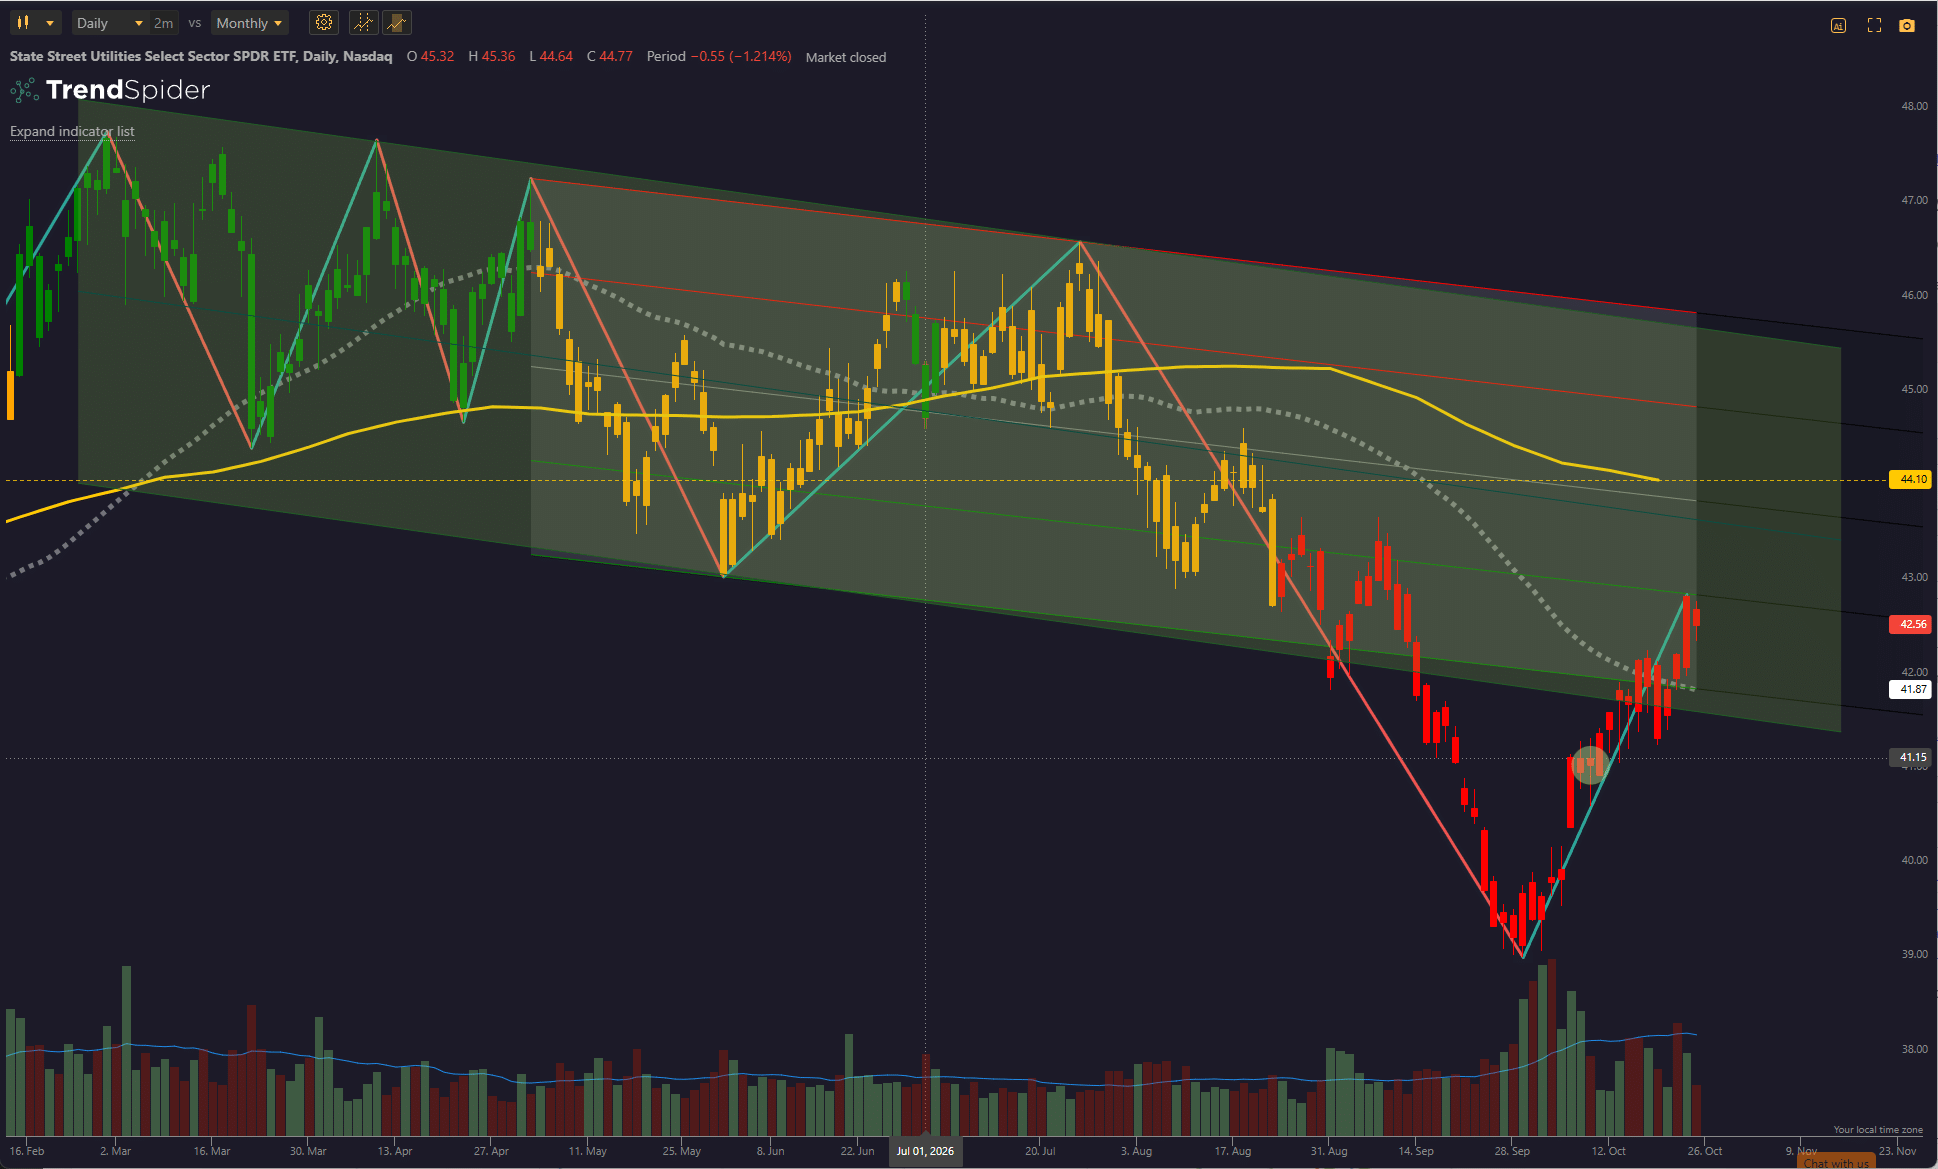 clearly in a downtrend channel and still in a Weinstein Stage 4 bearish regime. It will probably take a little time for this one to get more confirmation – although the momentum/acceleration signal might be a great mean reversion signal if we were looking to bottom-fish. As an “investor”, rather than a “trader”, I will skip this one until it looks more positive.
Finally, XLY looks like this:
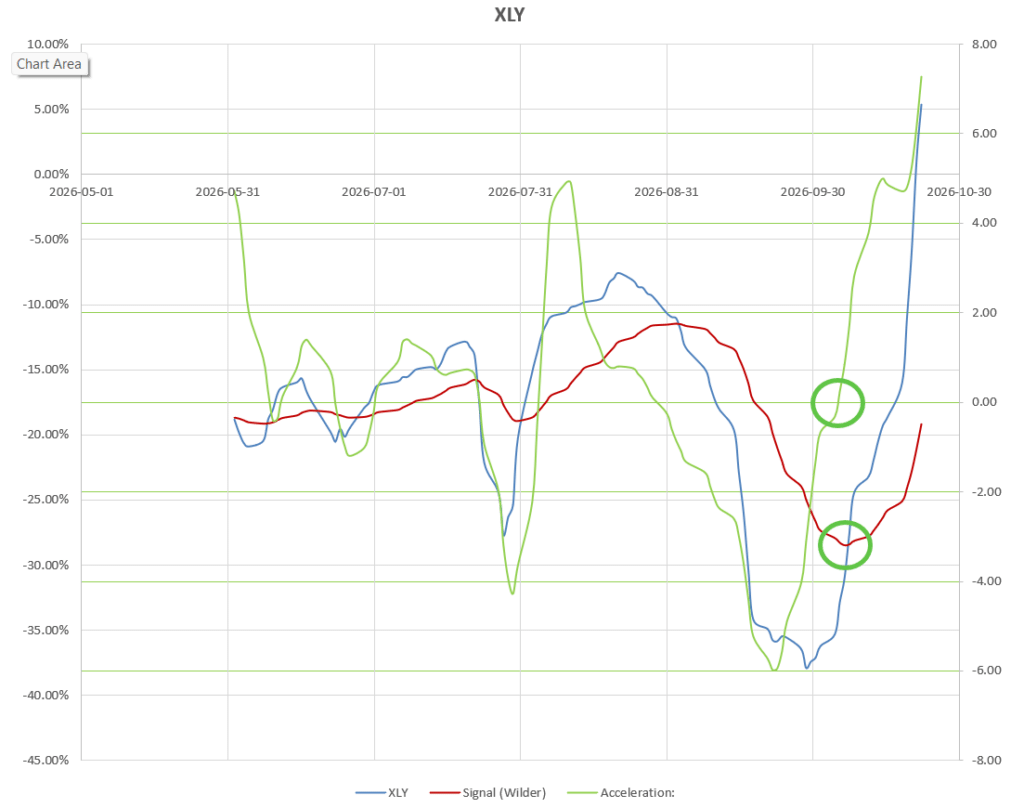 from the momentum/acceleration point-of-view, very much like XLB and XLU above, and the price chart looks like this:
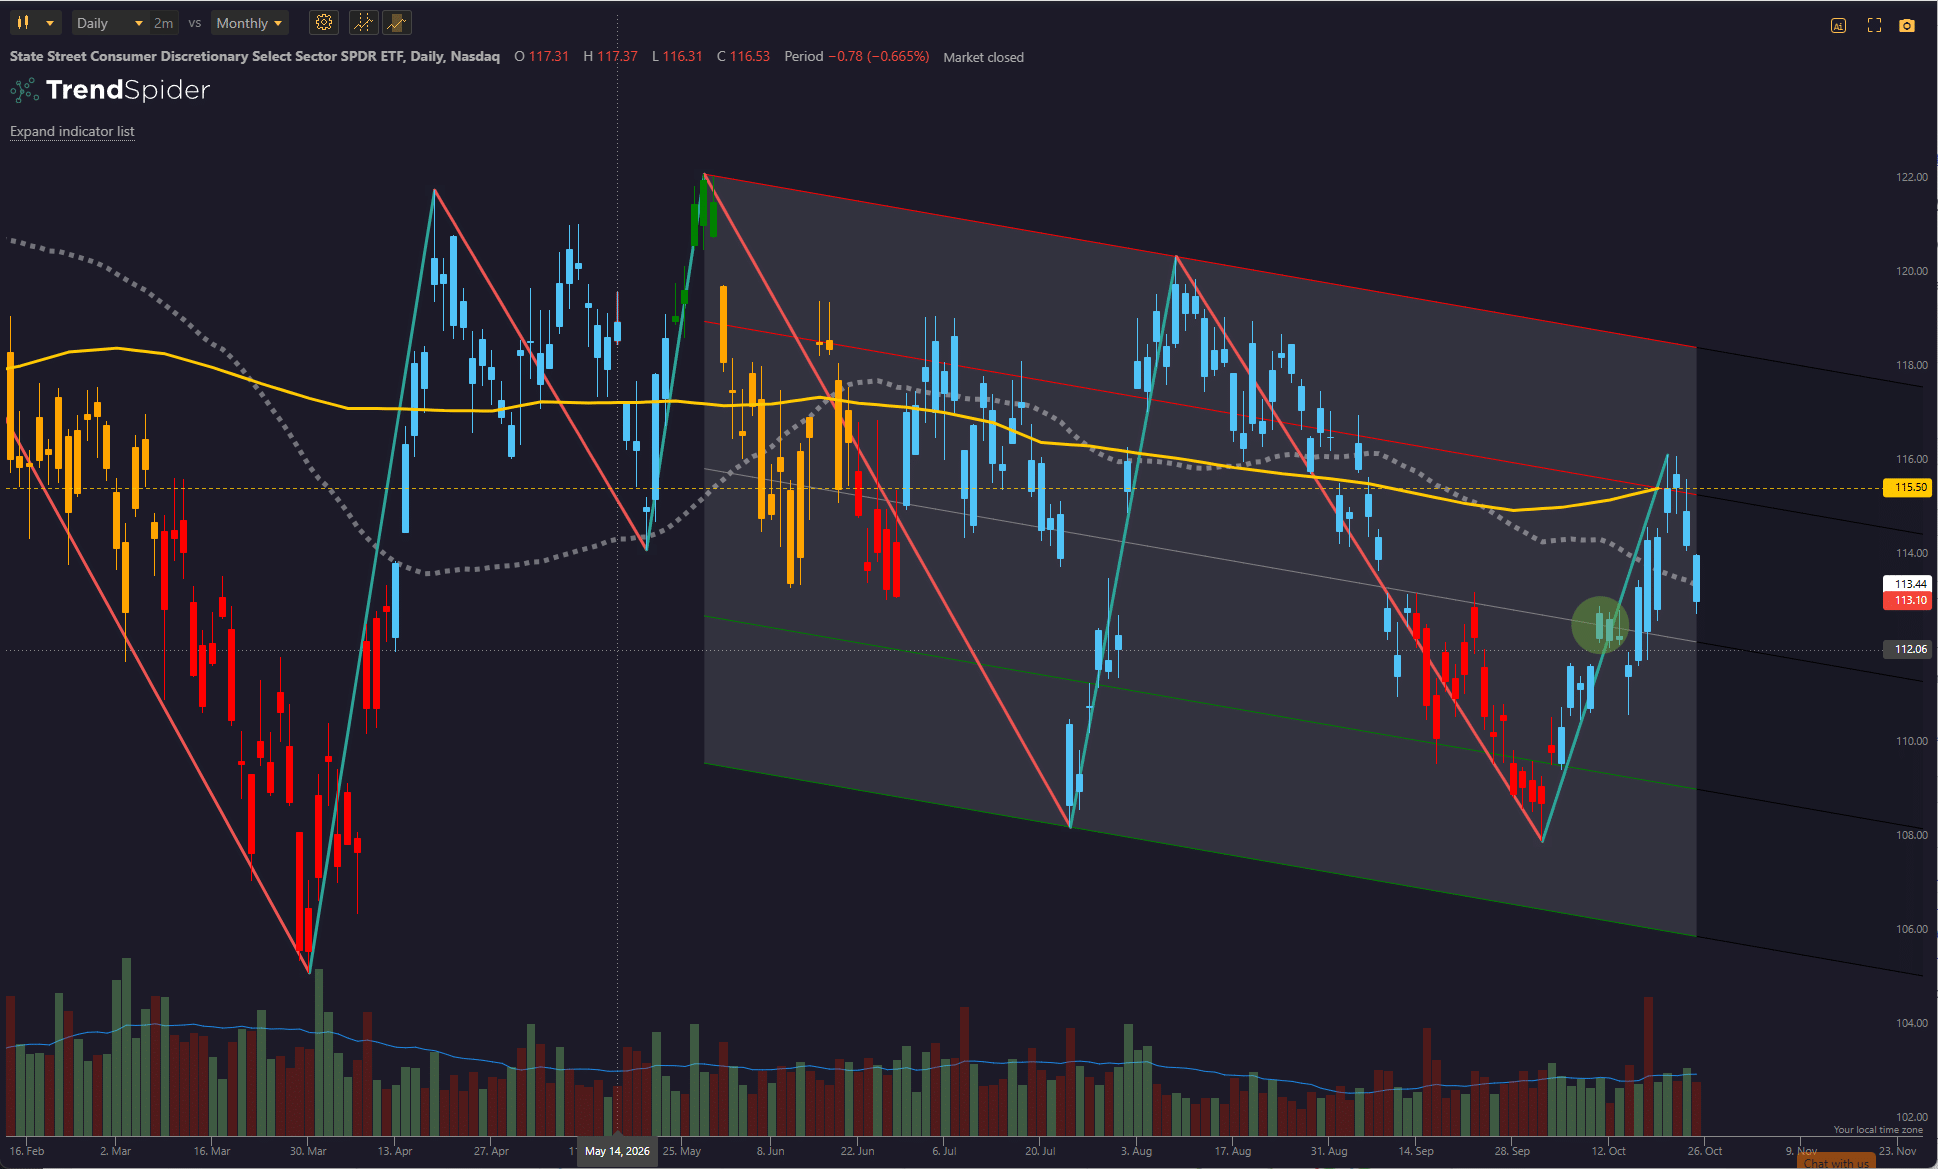 in a sideways consolidation mode, technically in Weinstein Stage 1 – so looking for a breakout into Stage 2 – but not showing a lot of bullish momentum over the past seven months. The momentum/acceleration signal is again indicated in the candle with a green circle. Again, a wait-and see situation for me.
Despite all this, the Dirac Portfolio is behaving reasonably well:
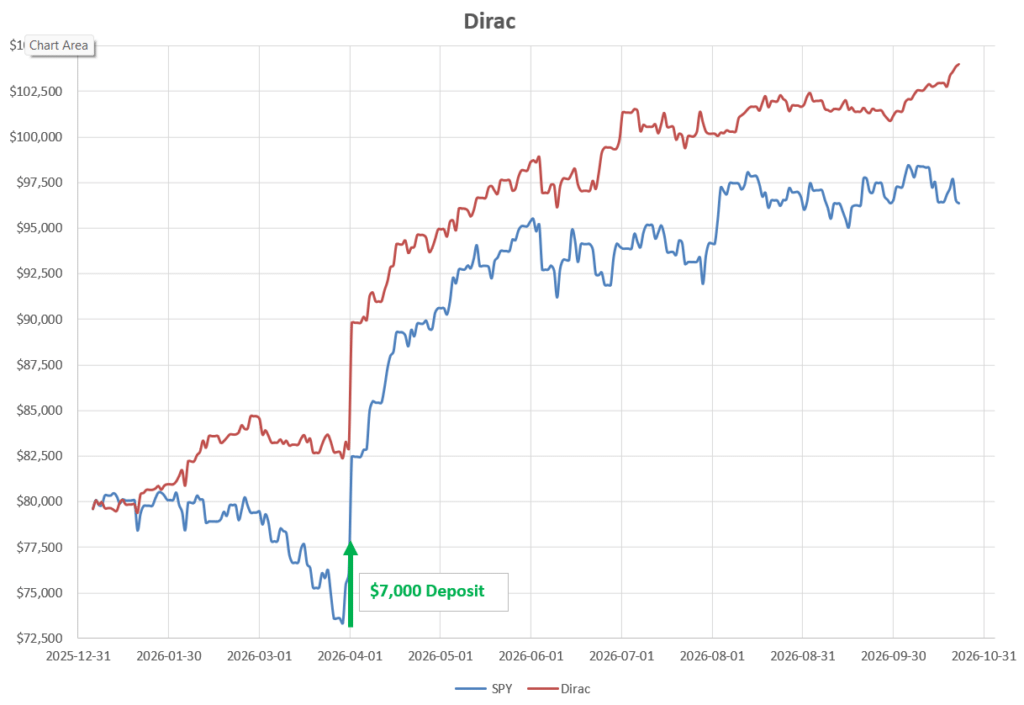 and has nicely outperformed the benchmark SPY fund since I started looking at the Weinstein stages for confirmation in the past month. But…. it’s early days and far too soon to say whether the benefits will be there over the long term – or whether it’s better to go bottom-fishing more often – but it does keep the trading level down a bit – which helps slightly with the allocation questions. At present the Dirac Portfolio is showing a 25% annualized Internal Rate of Return (IRR) Year-To-Date, with 12% Volatility, and is ~87% invested.
Discover more from ITA Wealth Management
Subscribe to get the latest posts sent to your email.
Leave a Comment or Question