
Amish Horse and Buggy – Lancaster County, Pennsylvania.
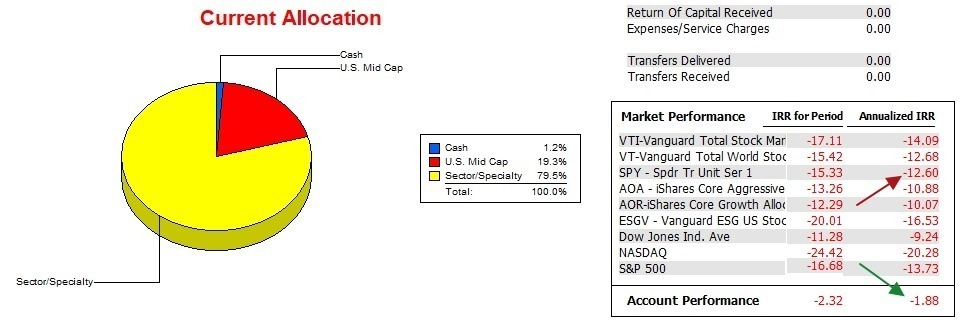
Carson is the original Sector BPI portfolio here at ITA and one to watch as this experimental model moves forward. Last week the annualized Internal Rate of Return (IRR) moved back into positive territory, only to slip back into negative territory when the U.S. Equities market took a hit on Friday.
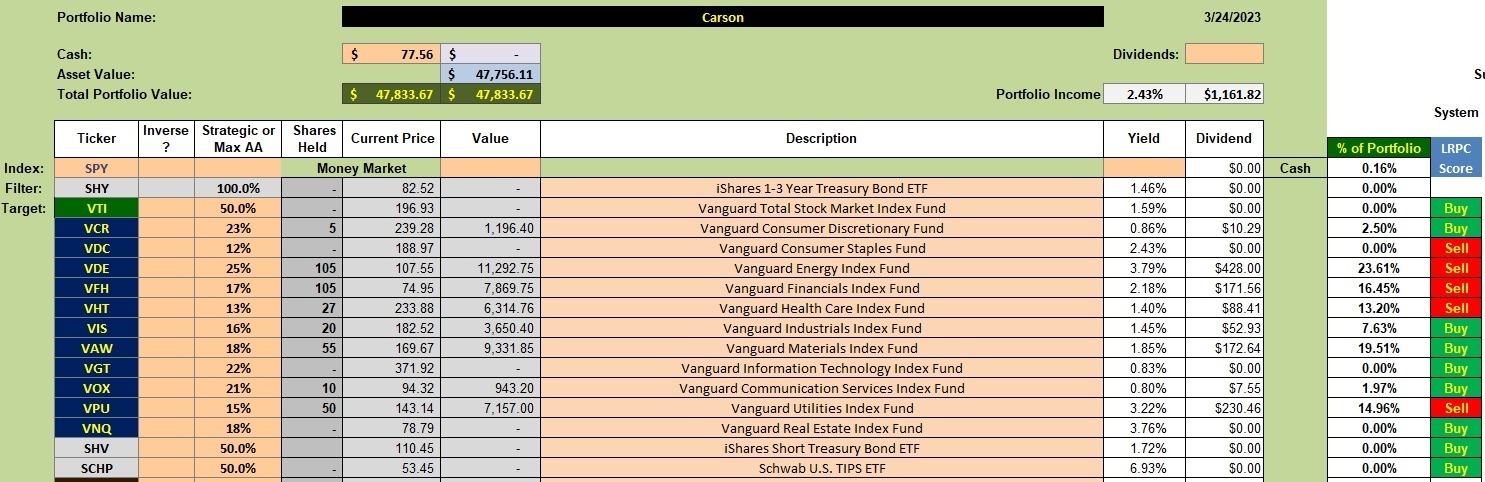
Based on the latest Bullish Percentage Indicators, five (5) sectors are over-sold and therefore indicate a Buy signal for this investing model. Those sectors are: Energy, Financial, Industrial, Materials, and the newcomer, Real Estate.
Carson Investment Quiver and Holdings
Below is the Investment Quiver for the Carson. If you check the third column from the left you will see the recommended percentage. These percentages are calculated by multiplying 0.70 x three-year volatility percentage. The more volatile the sector the high the percentage to invest. Compare that Max AA value with the actual percentage which is found in the second column from the right. For example, 25% is recommended for Energy (VDE) while the portfolio holds 23.6%. This is sufficiently close, particularly if another recommended sector needs cash to fill its quota. Real Estate (VNQ) is such a sector. There is insufficient cash to raise VNQ to the 18% level.
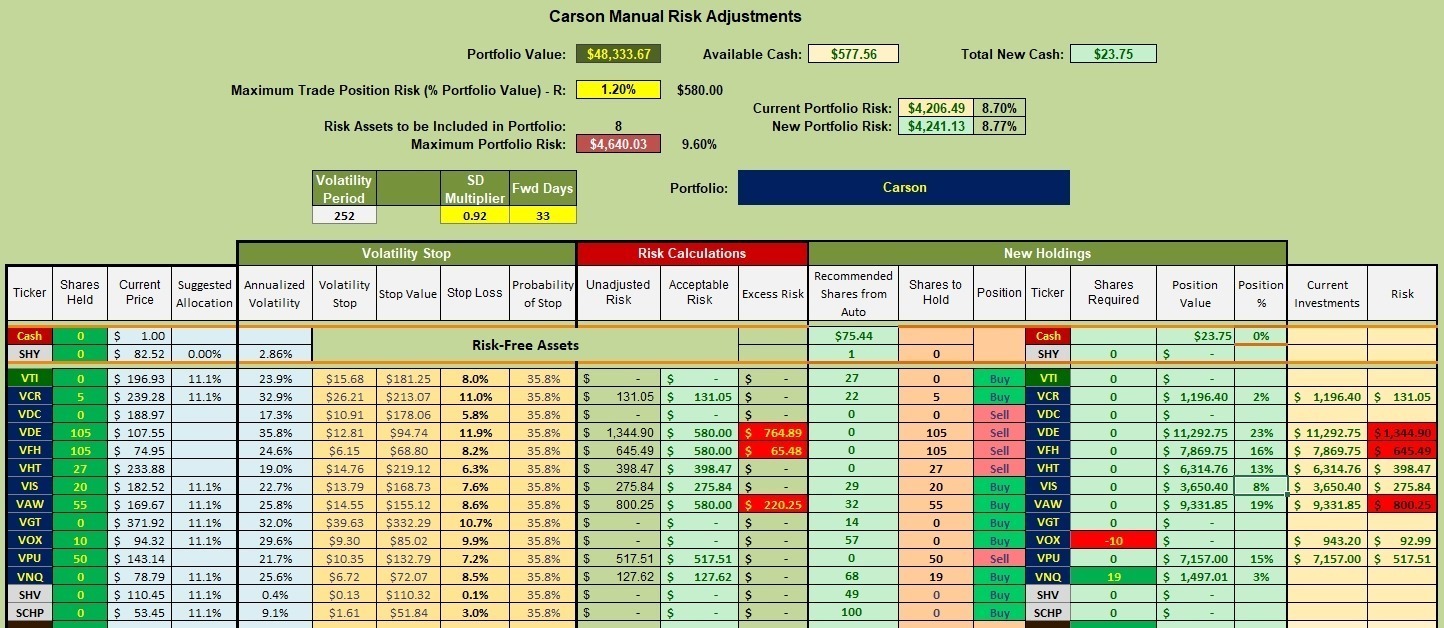
Carson Manual Risk Adjustments
When I launched the Carson some months ago there were no sectors in the over-sold zone (30% or lower with bullish stocks) so I purchased 10 shares of VOX as this sector was very close to a Buy. Now that I need cash to build Real Estate (VNQ) up to the 18% level I’ll sell all shares in VOX in order to have a little cash to invest in Real Estate. Otherwise, no changes in the Carson.
Carson Performance Data
Over the past 15 months the Carson has outperformed all possible benchmarks by a wide margin. Since the Sector BPI portfolios are based on securities found in the S&P 500, I am using SPY as the benchmark. For more information on benchmarks, check the Category pull-down menu and look up blog posts on benchmarks.
Carson Risk Ratios
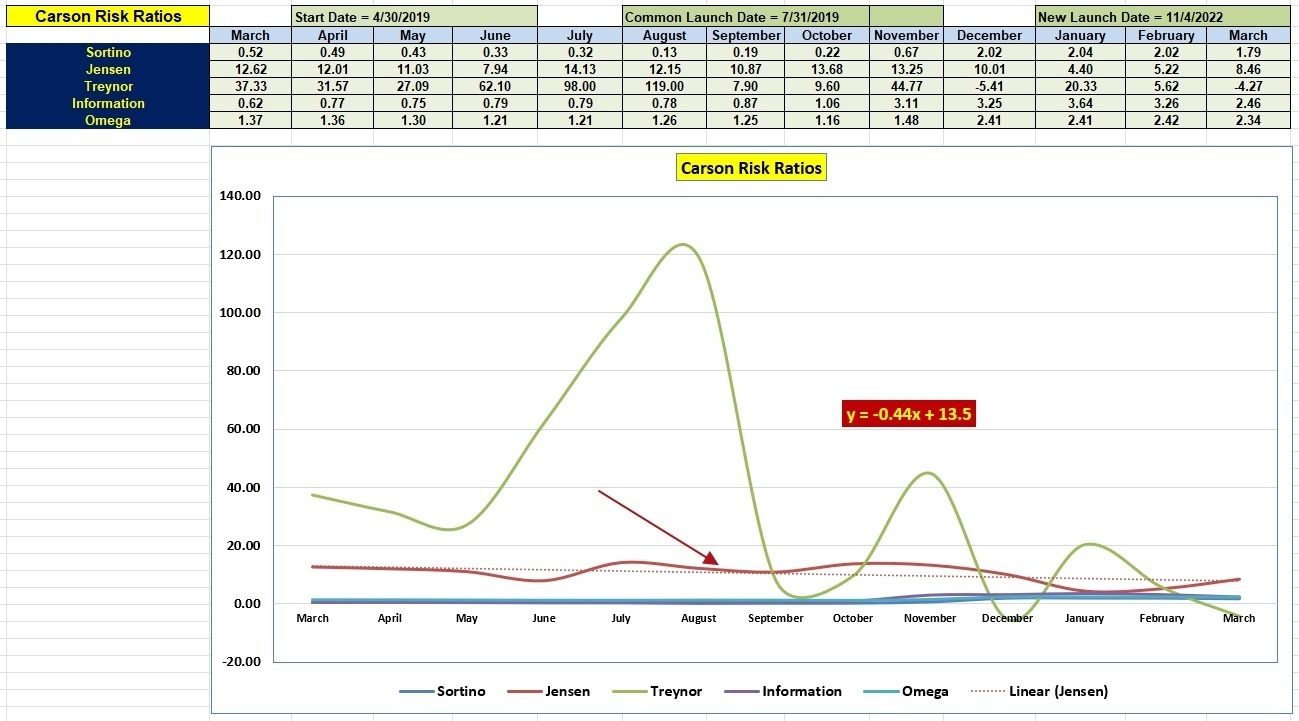
The following data and graphs show how well the Carson is performing when risk measurements are included in the performance/risk equation. Pay most attention to the Sortino, Jensen, and Information values. Comparing current values with March numbers of 2022, only the Jensen declined over this period. Part of that decline is due to the rise in interest rates as short-term rates are part of the Jensen calculation.
Checking the Information Ratio, we see where the performance of the Carson has not kept pace with SPY over the past few months. This is a concern and something we need to keep an eye on as this is a critical measurement when it comes to evaluating the Sector BPI investing model.
New Carson Launched: 4 November 2022
Buying Guidelines For BPI Model Portfolios: 9 December 2022
Note: The ITA Wealth Management blog is free to all who register as a Guest. Pass this information on to your friends and family members.
Discover more from ITA Wealth Management
Subscribe to get the latest posts sent to your email.
You must be logged in to post a comment.