
Musician Playing Traditional Balinese Rindik (Xylophone)
As we go into the mid-third of the year (the lazy-hazy days of Summer), in a somewhat uncertain world, it seems as though investors don’t care about global political and economic problems any more and US equity markets continue to grind higher and to make higher highs week after week. This is exactly what happened again this week:
 We broke through resistance at ~7150 on Thursday and, unless the move higher was simply a result of short covering, we could well be on our way to the next potential resistance level at ~7400 (yellow ellipse) that corresponds to a 50% Fibonacci extension from the March pivot low. A retest of the 6800 support level may be a possible downside target in a panic or in weakness, although we need to get through the psychologically important 7000 barrier (big round number), that provided strong resistance in February at the end of the prior bullish trend.
US Equities was not the strongest asset class over the past week:
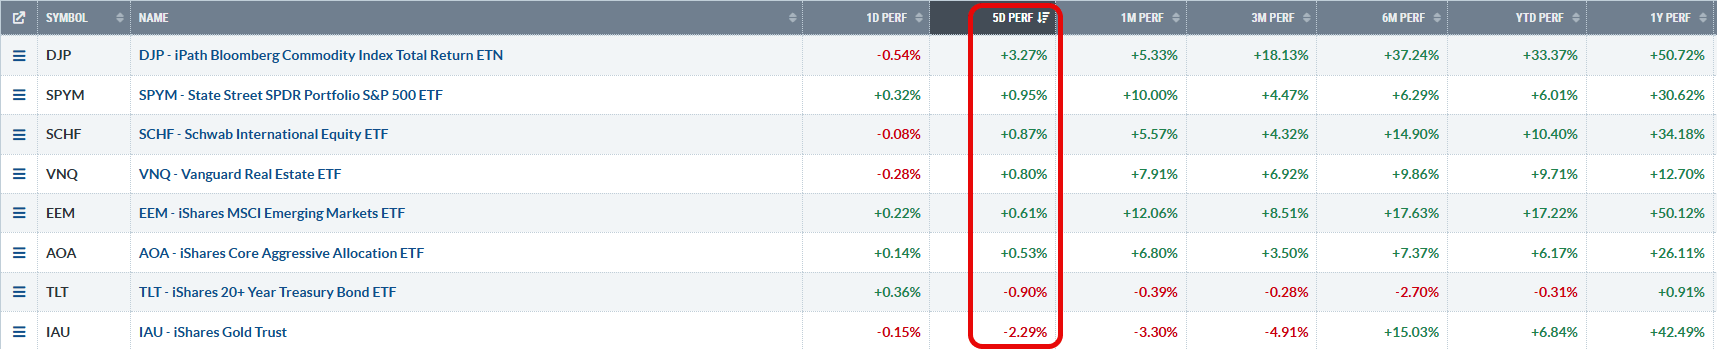 as commodities showed renewed strength after a 2-month consolidation period:
 The Darwin Portfolio represents a quiver of ETFs designed to survive Lowell’s “Financial Repression” scenario with the main difference being that it is more actively managed and rotates between assets rather than relying on fixed allocations in all asset classes to provide diversity and to reduce volatility.
At the present time the analysis sheet of the momentum/acceleration model used to manage this portfolio looks like this:
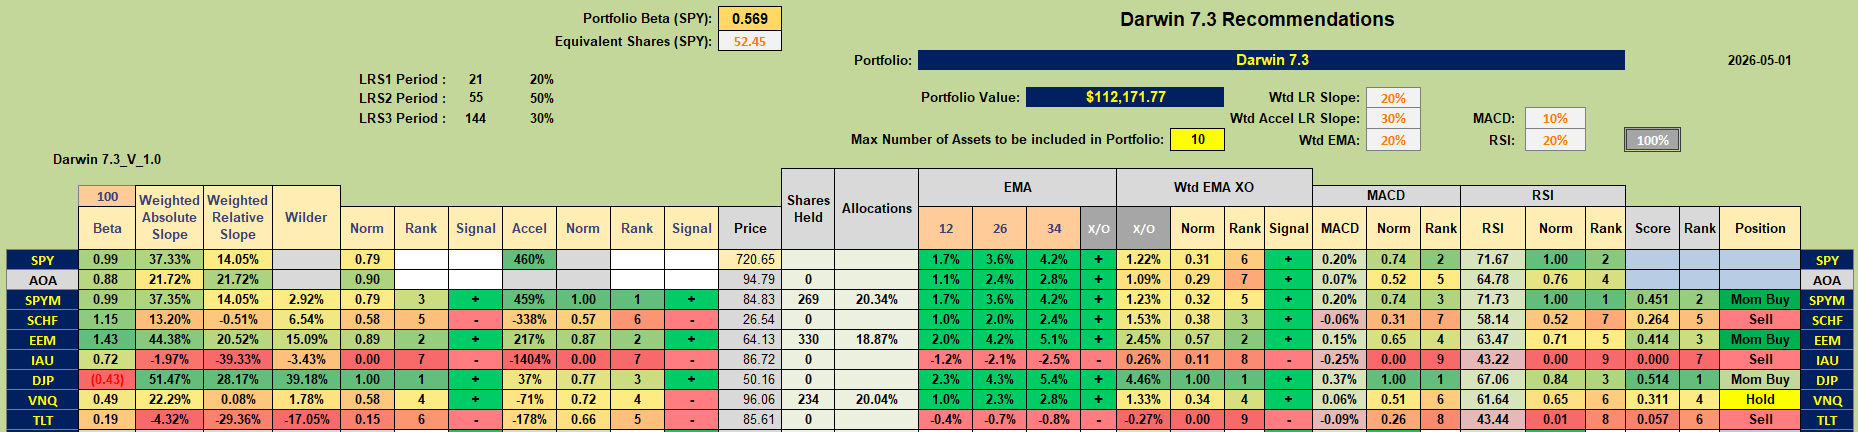 with Momentum Buy signals for SPYM (US Equities), EEM (Emerging Market Equities) and DJP (Commodities) and a Hold recommendation for VNQ.
IAU (Gold) and SCHF (Developed Market Equities), that were held in the portfolio last week are now showing Sell recommendations and have been sold out of the portfolio.
Let’s take a look at the justifications for these adjustments by looking at the momentum/acceleration graphs. First IAU:
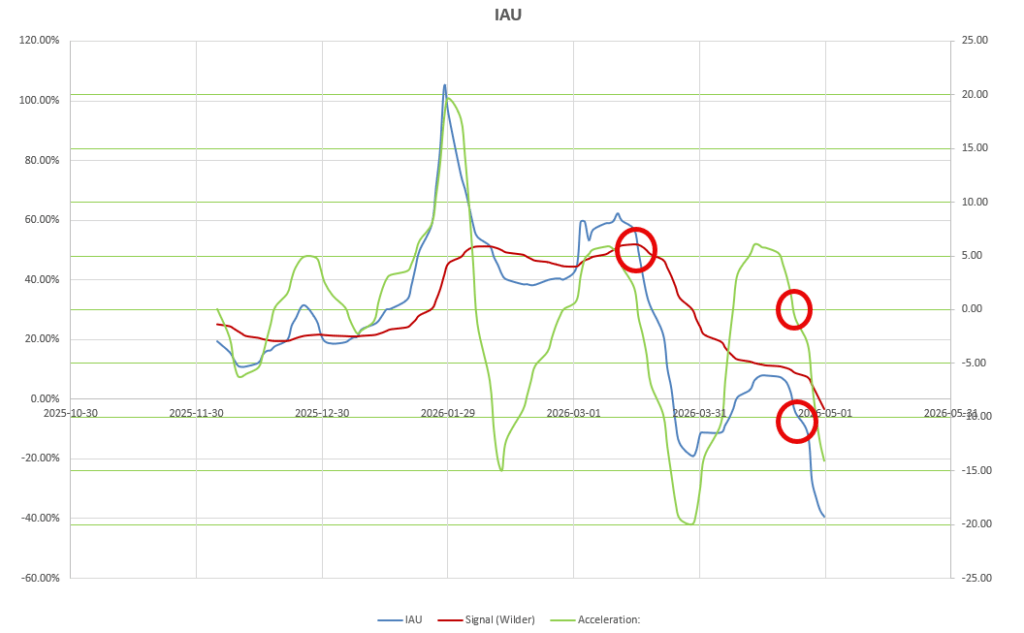 where momentum (blue line) crossed below it’s 14-period Wilder Moving Average (brown line) over a month ago but acceleration (green line) and short-term Indicators (MACD and RSI) had been showing strength and generating positive signals. This has now all changed and all signals are now in negative territory. Consequently, shares in IAU were sold out of the Portfolio on Monday as prices opened lower. This generated a modest loss (~$440) but was appropriate as prices continued to drop throuout the week:
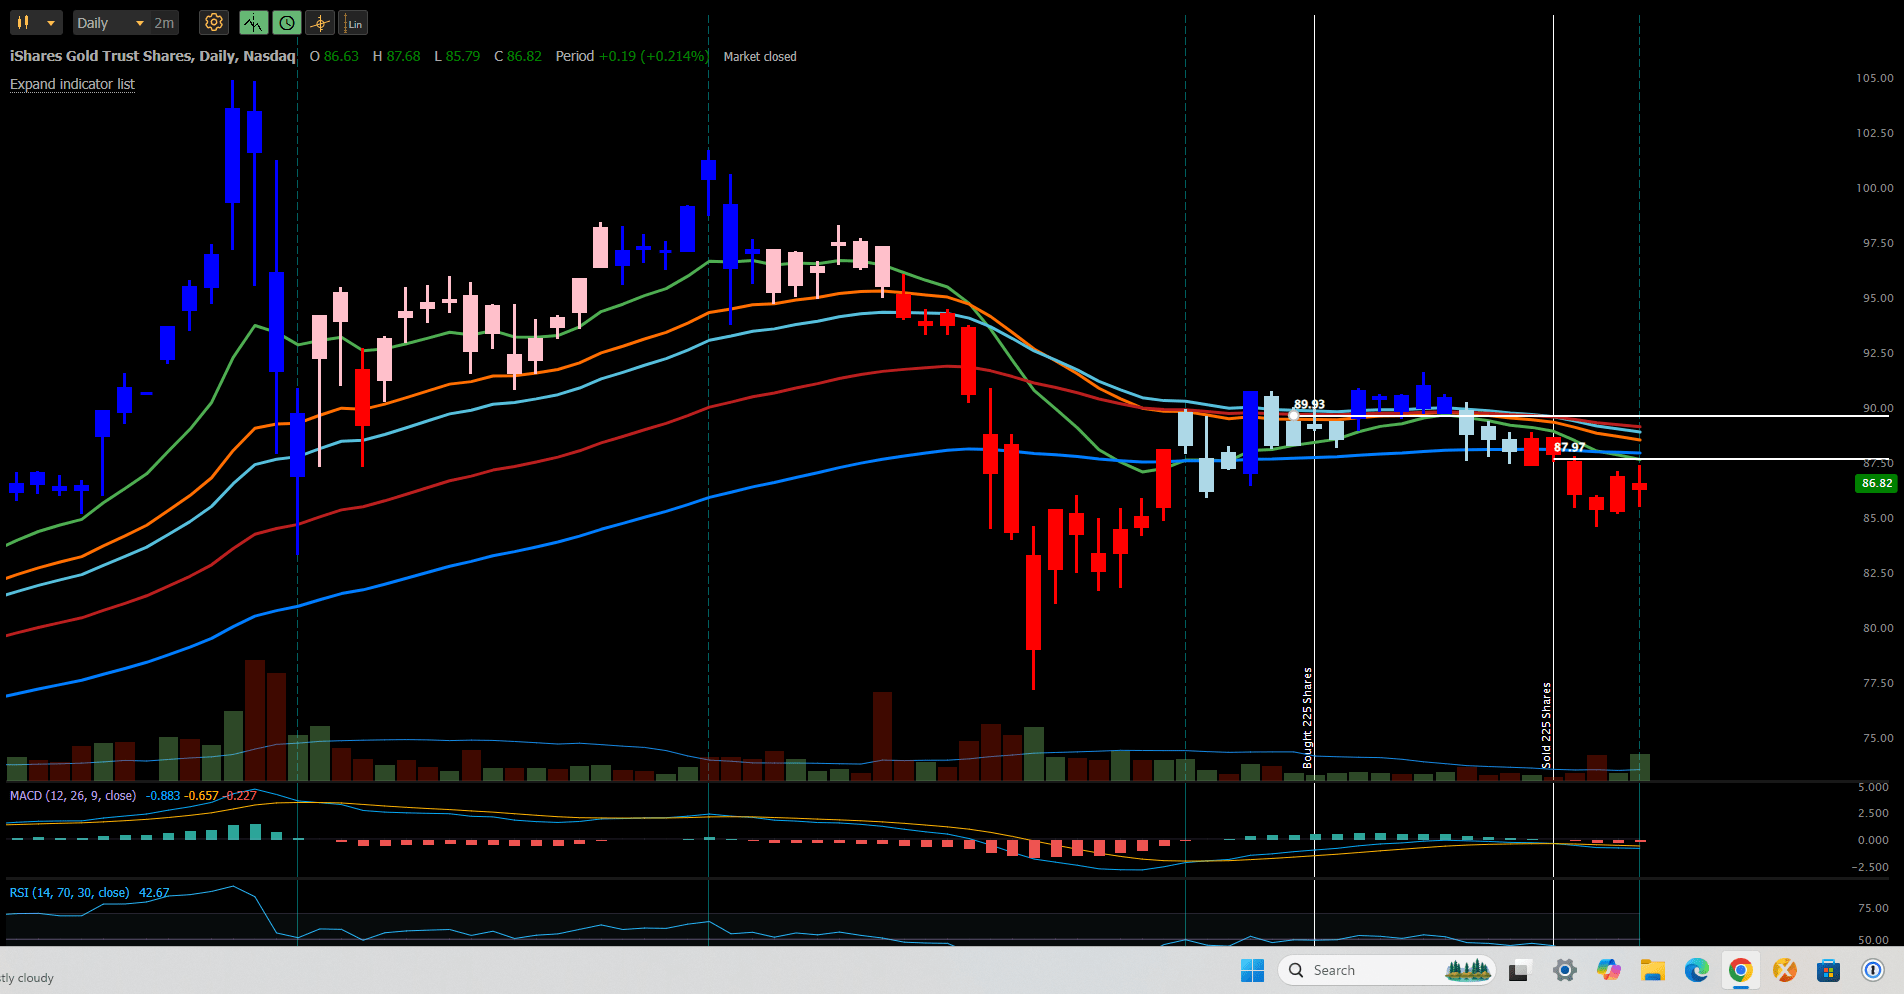 This could still be a normal pullback since we haven’t taken out the March pivot low and the current environment is conducive to “flights to safety” where Gold resides. Should this happen I can always re-enter if and when the signals change.
Next is SCHF:
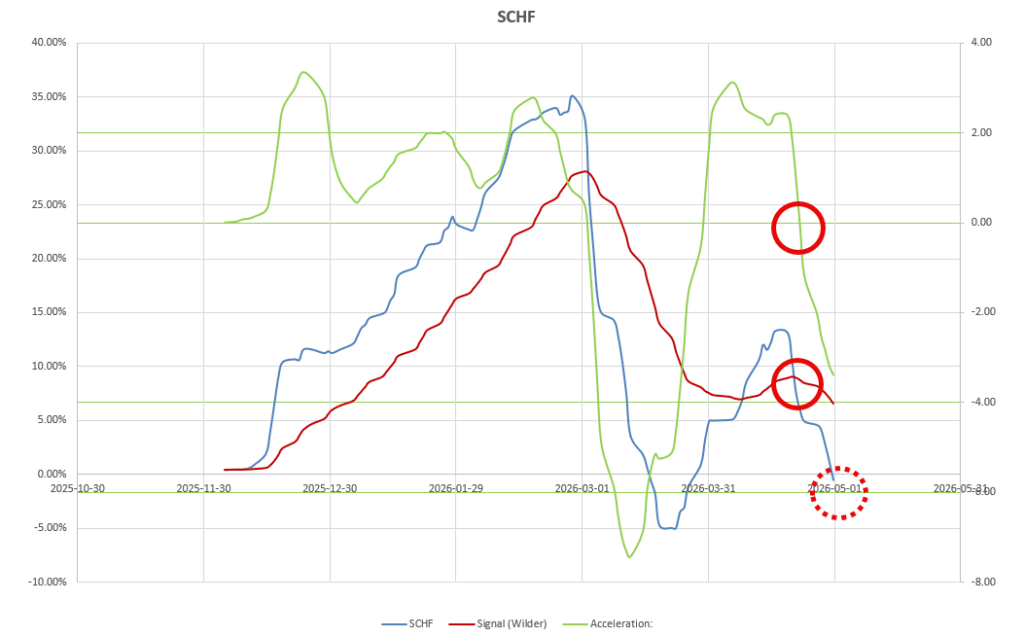 that was showing negative acceleration with momentum falling below it’s Wilder Moving Average at the beginning of the week but with MACD and RSI indicators still showing short-term positivity. Relative Momentum (blue line) is presently heading strongly in a downward direction and will almost certainly fall into negative territory on Monday. This, combined with MACD also turning negative and SCHF trading below Thursday’s close, were the reason for me selling out of this ETF late on Friday to lock in a nice gain:
 This ETF is not looking overly weak and I will probably jump back in should prices hit new highs around the $27 level. However, I will trust the algorithm and follow the recommendations at this point, especially with a nice profit and hitting potential resistance at $27.
This leaves DJP (Commodities) to look at for a possible Buy:
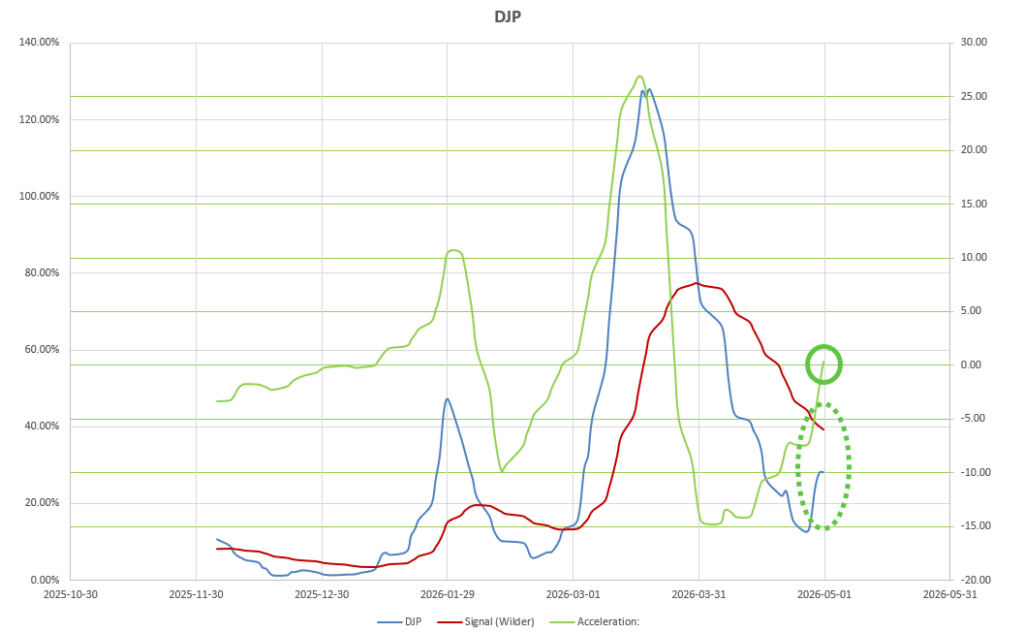
where we see positive acceleration and momentum although momentum has not yet crossed above its Wilder Moving Average. However, the short-term MACD and RSI indicators are both positive so I would have added this ETF to the portfolio on Friday except for the fact that it was trading at a price below Thursday’s close. So, I will wait for it to trade higher and, likely, for momentum to cross above its Moving Average before entering. The Chart at the top of this post (3rd screenshot) looks encouraging.
The only remaining questionable position is VNQ that currently looks like this:
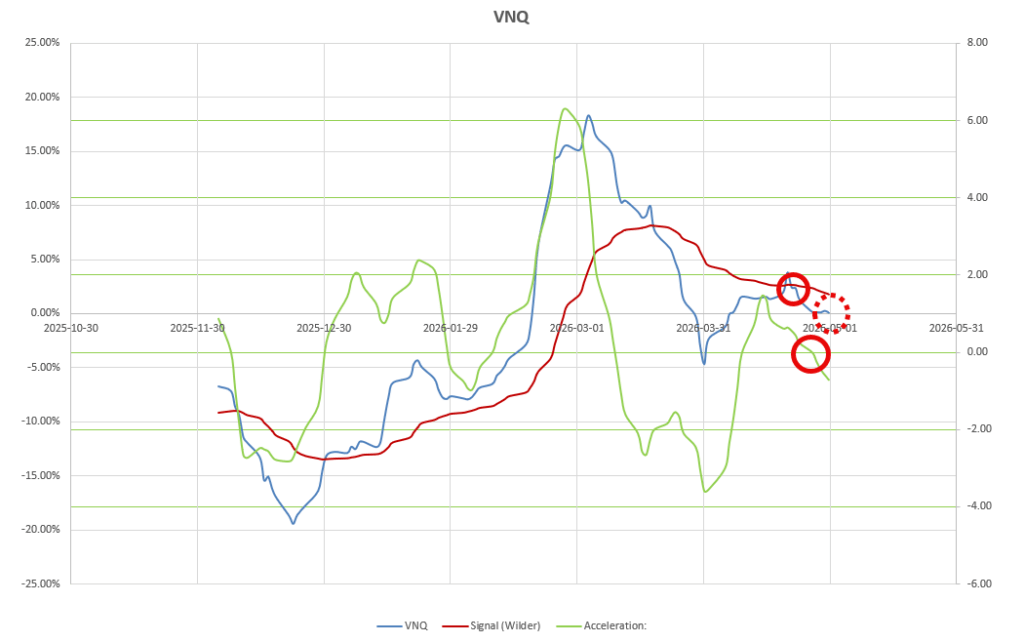 with negative acceleration and momentum below it’s Moving Average. Relative momentum is also still positive but is very close to the cross-over line into negative territory. MACD and RSI are in positive territory so there is no obvious reason to panic or sell – and this ETF does pay a nice dividend. The current position is showing a profit so I will probably continue to hold (but not add to the position) unless signals change in the wrong direction.
Trading activity this week looks like this (red box)
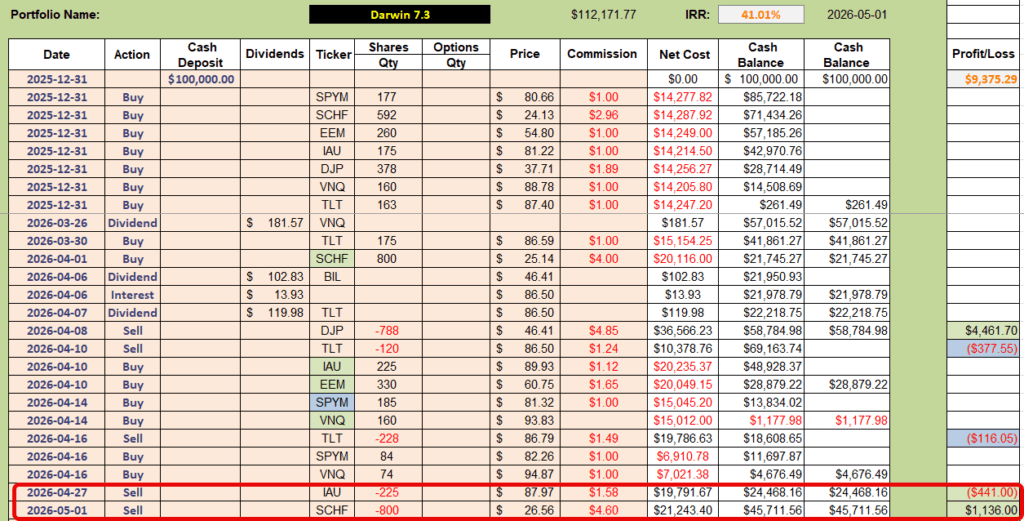 with portfolio performance like this:
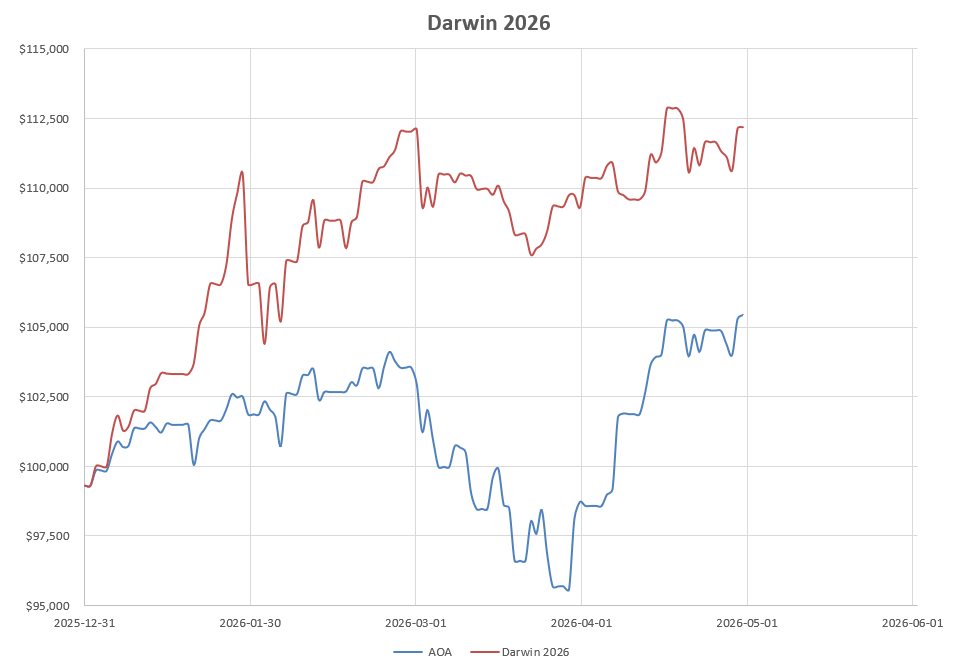 …still well ahead of the benchmark AOA Fund.
With only three ETFs currently held in the portfolio and ~$45,000 (40%) in Cash (BIL) I will be looking to add new holdings (likely DJP) and/or more shares of existing holdings to the portfolio in order to move closer to fully invested (one of the management objectives) – otherwise it is difficult to stay ahead of the benchmark – unless the market collapses.

Discover more from ITA Wealth Management
Subscribe to get the latest posts sent to your email.
DJP (Commodities) were trading higher than Friday’s close at 10:00 am so I have opened a new position (450 shares) in this ETF. DJP retains its moderate Momentum Buy ranking/classification with only momentum below it’s Wilder moving average as a negative/non confirming signal.