
“The Prince of Greenwich” – Funky Pub in London
US Equities pushed higher this week, despite geopolitical uncertainties, and closed the week ~ 3.5% higher than last week’s close after testing the important 6100 level in the SPX (S&P 500 Index) and breaking out to new all-time highs:
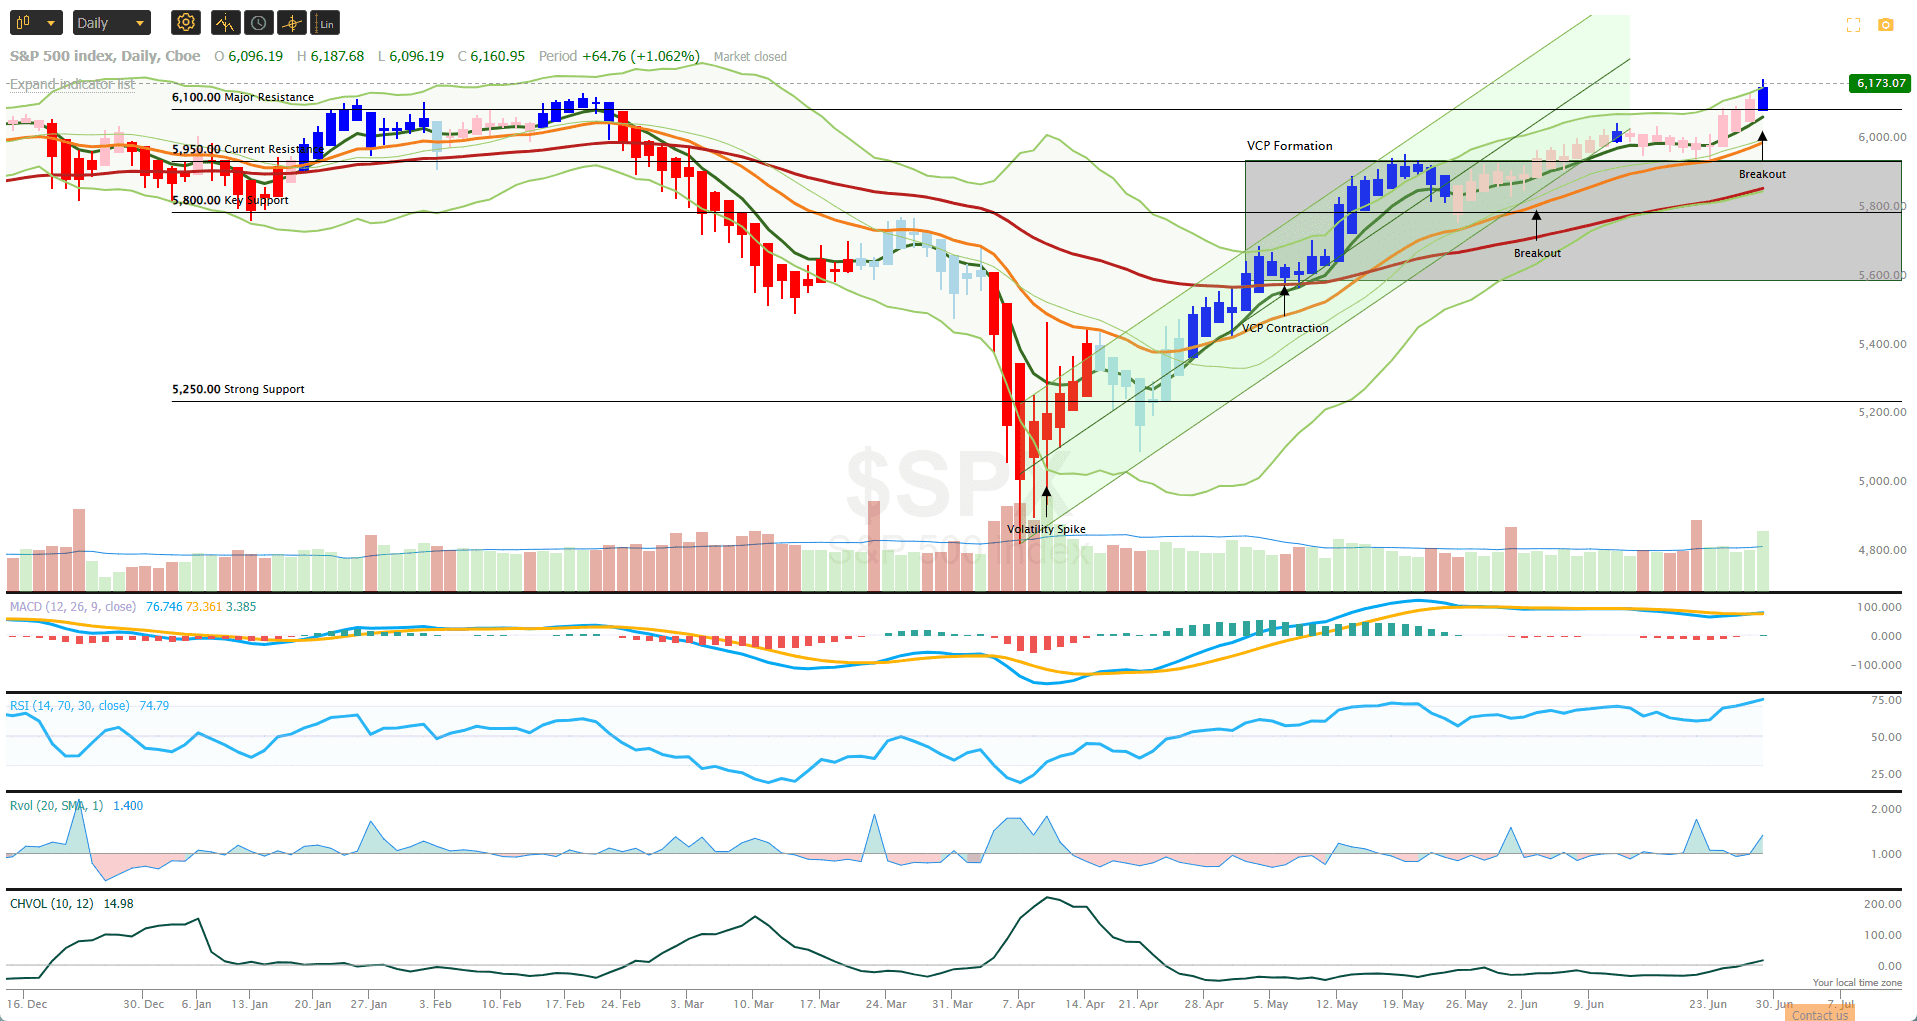
We shall have to wait to see whether there is any follow-through on this, with convincing volume, or whether we just see a short-term “dead cat bounce” caused by short covering at this significant potential resistance level. Both the MACD and RSI Indicators are sending bullish signals (resulting in dark blue candle on Friday) but, with this being a shortened trading week ahead of Independence Day on Friday, I would not normally expect to see high volumes over the next few days (unless there is unexpected/unanticipated news).
Compared to other major asset classes, US equities still only managed to come out in the middle of the pack:
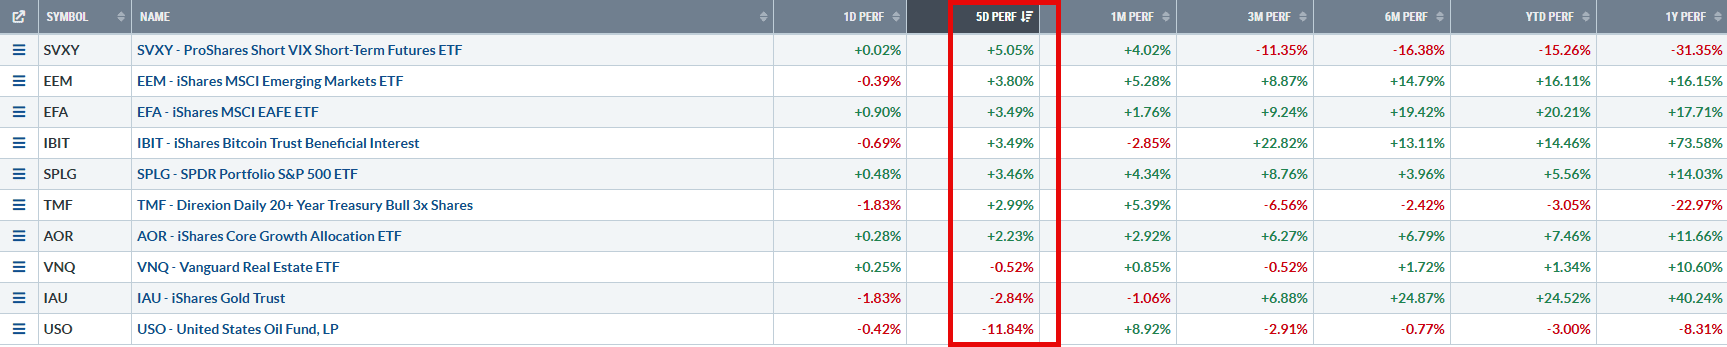 with International equities faring slightly better. Oil was the big loser losing close to 12% on the week.
Darwin Core Portfolio:
Despite the fact than I am over-allocated in USO (Oil) – more on this below – the portfolio continued it’s steady climb higher with low volatility:
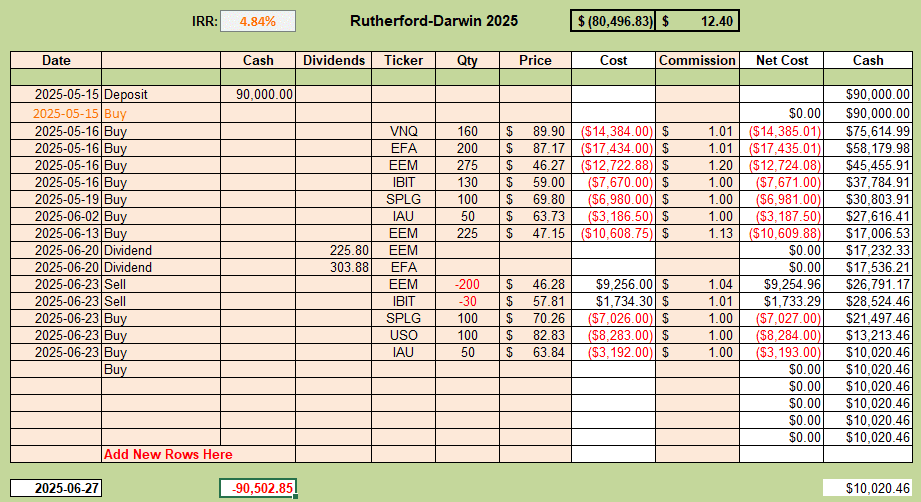
The above screenshot shows the adjustments made after last week’s review. Current IRR is showing a ~5% Internal Rate of Return (IRR), although this number can’t be considered too reliable until we see at least 12 months of performance. Performance is probably a little better than shown in the above screenshot since SPLG and VNQ went ex-dividend towards the end of the week (with a negative price correction) but dividends are not paid into the account until tomorrow (30 June) so will not appear until next week’s review.
If we check an rankings and recommendations we see the following picture for our “tight” portfolio management rules i.e. requiring an asset to be showing positive acceleration in momentum and ranking stronger than the S&P 500 (SPY):
 In this case we only see a Buy signal for SPLG (representing US Large Cap Growth stocks) with Hold recommendation on all other ETFs currently held in the portfolio.
Relaxing the requirement for Funds to be ranked higher than SPY changes this picture slightly:
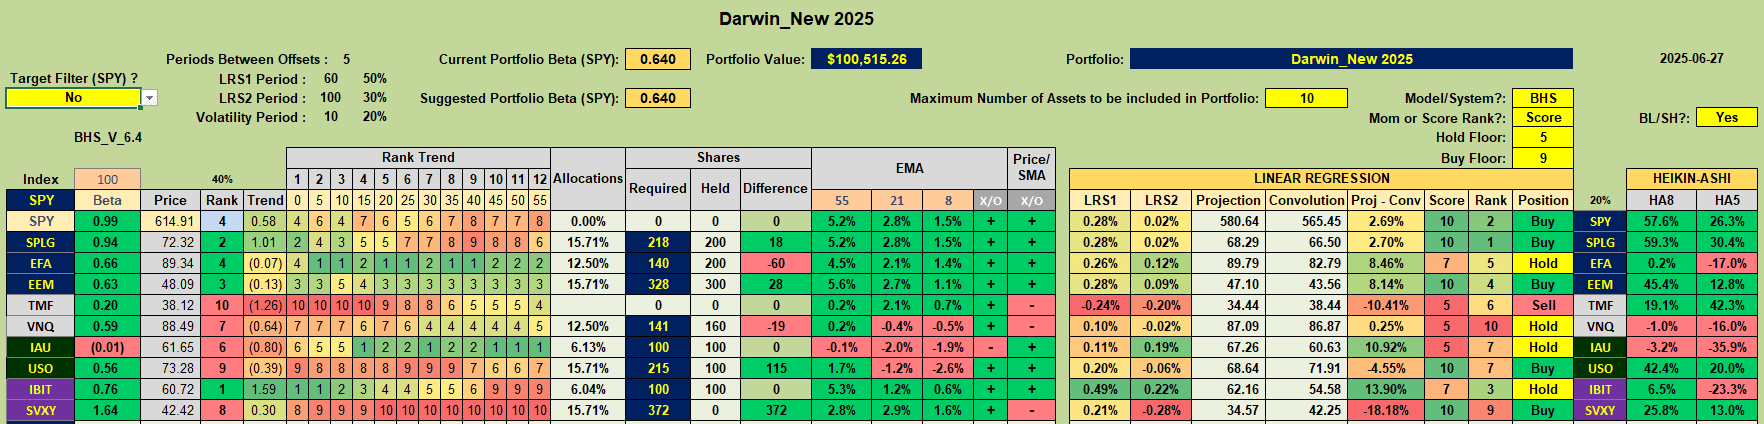 with EEM and USO also showing as Buys rather than Holds (i.e. might consider adding to existing positions if called for). SVXY is also a recommended buy but, since this is an inverse volatility ETF that benefits from falling volatility and because volatility is currently at a relatively low level, in a potentially high volatility environment, I am going to ignore this recommendation at this time.
Based on the above screenshots, VNQ (Real Estate) and IAU (Gold) seem to be under the most pressure showing short-term weakness in the HA signals – so, let’s take a look at the price charts:
First VNQ:
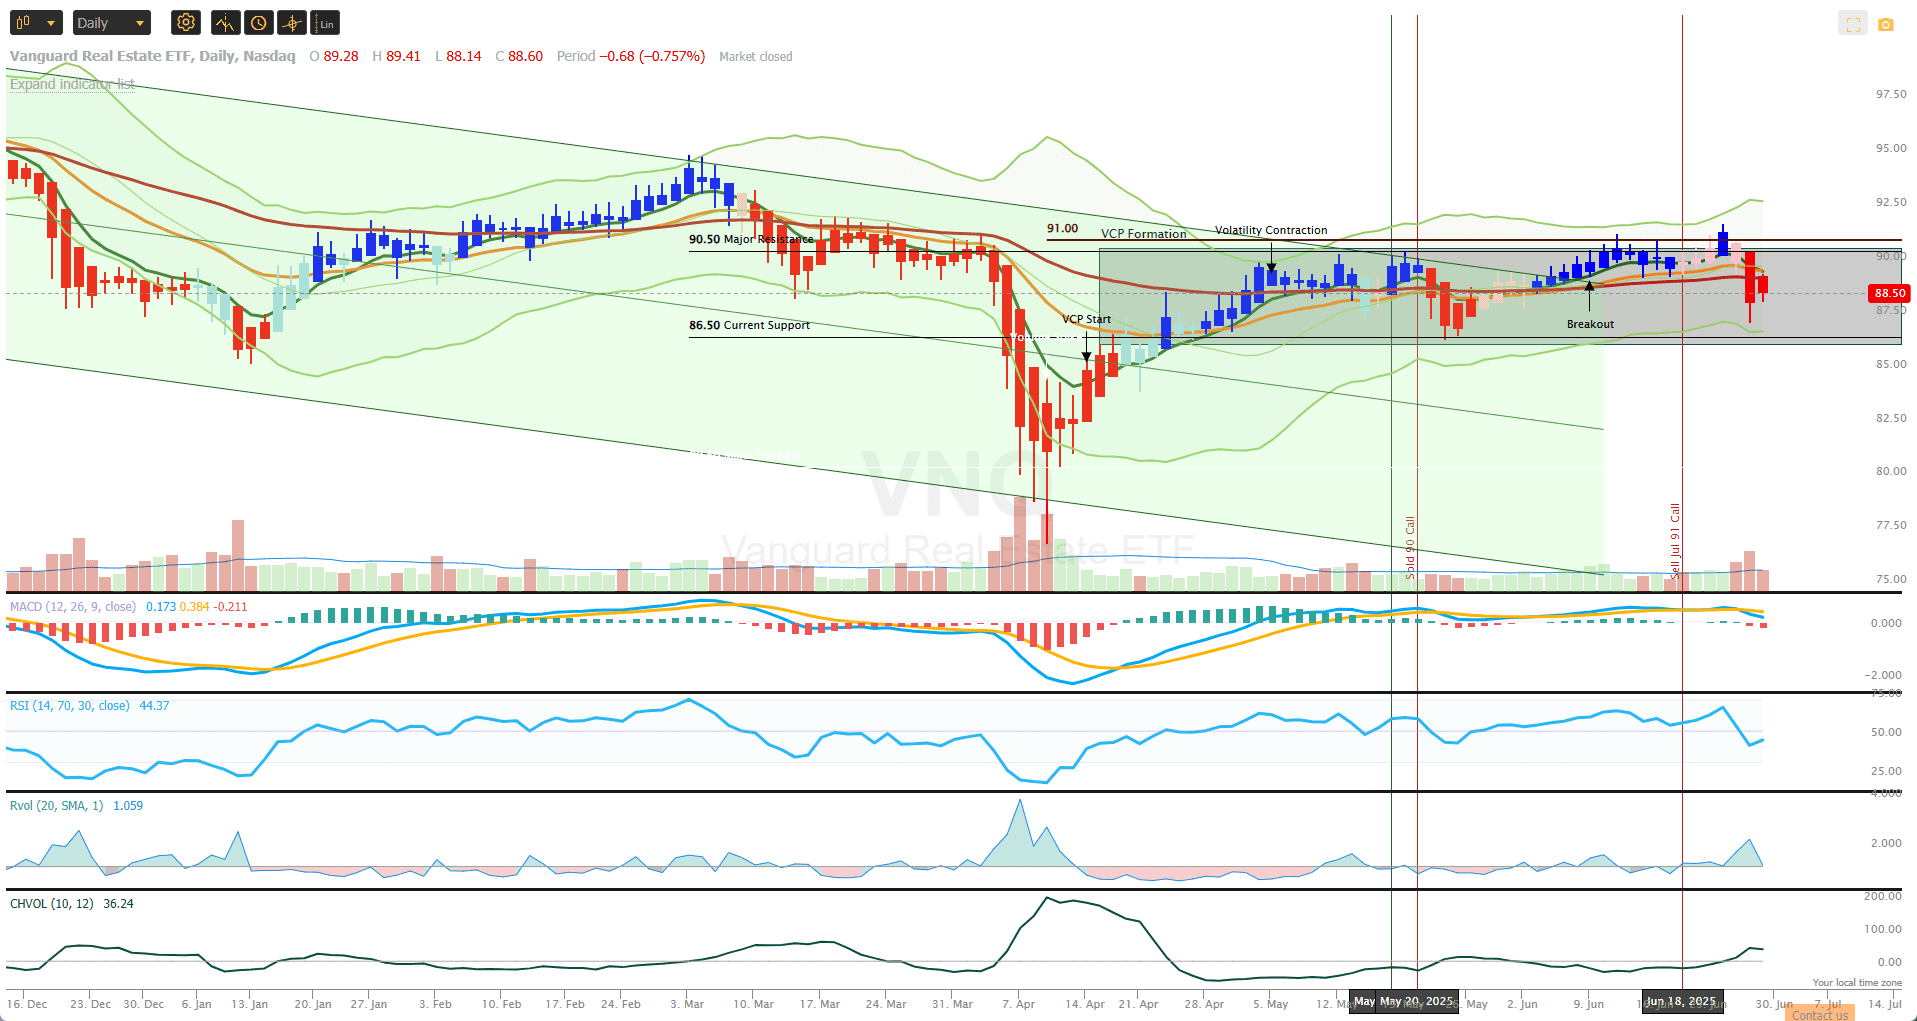 where we see that price has now dropped below all the Exponential Moving Averages (8-, 21- and 55- period EMAs) and the 8-period EMA has crossed below the 21- period EMA (bearish) but neither of these have dropped below the 55-period EMA. Neither has price dropped below the previous low at 86.50, so we have not generated a lower low and are still technically in a bullish trend. However, this is one to watch carefully and to be prepared to sell on signs of continued weakness.
Similarly for IAU, the picture is almost the same:
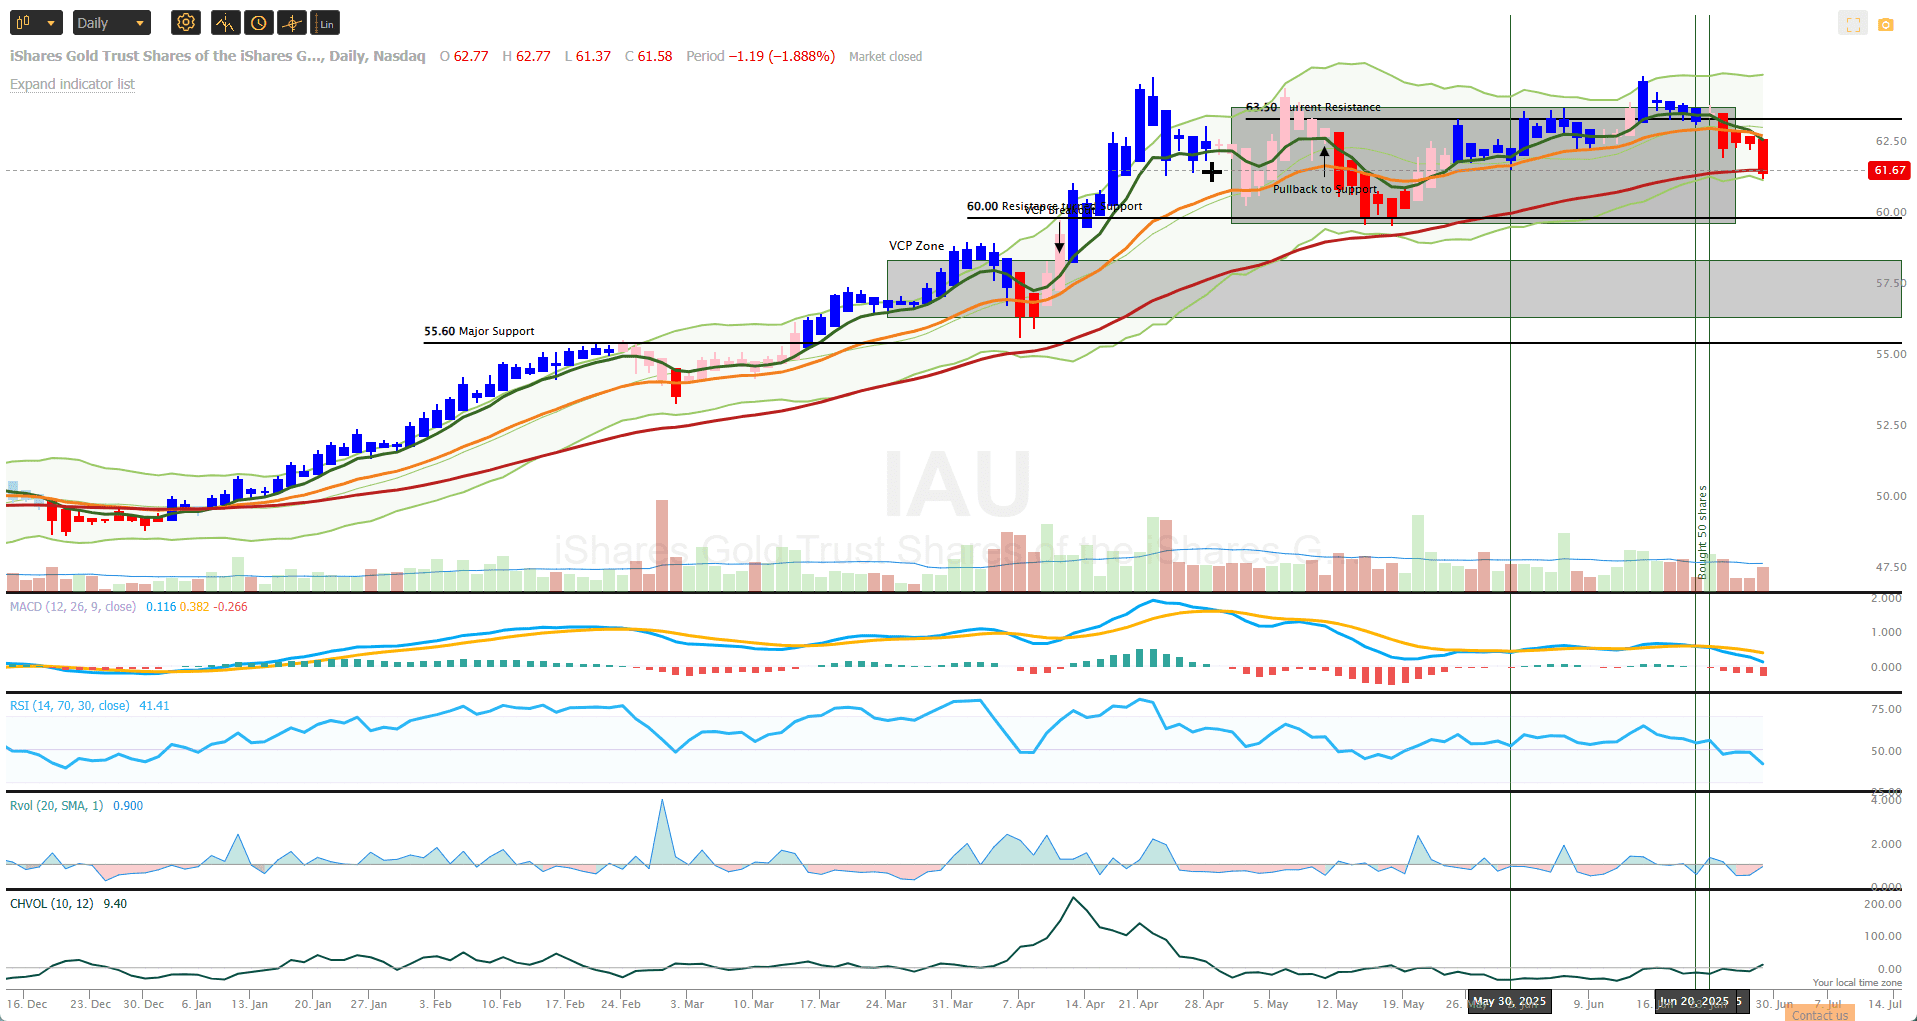 and any further weakness would be a signal to exit our position. In both cases the MACD and RSI are in bearish agreement – so we are close to an exit here unless we see a recovery in the next week.
Although USO is not showing obvious signs of weakness in the Kipling rankings, prices did drop dramatically a few hours after I bought 100 shares last Monday 🙁 – so let’s check the chart of USO:
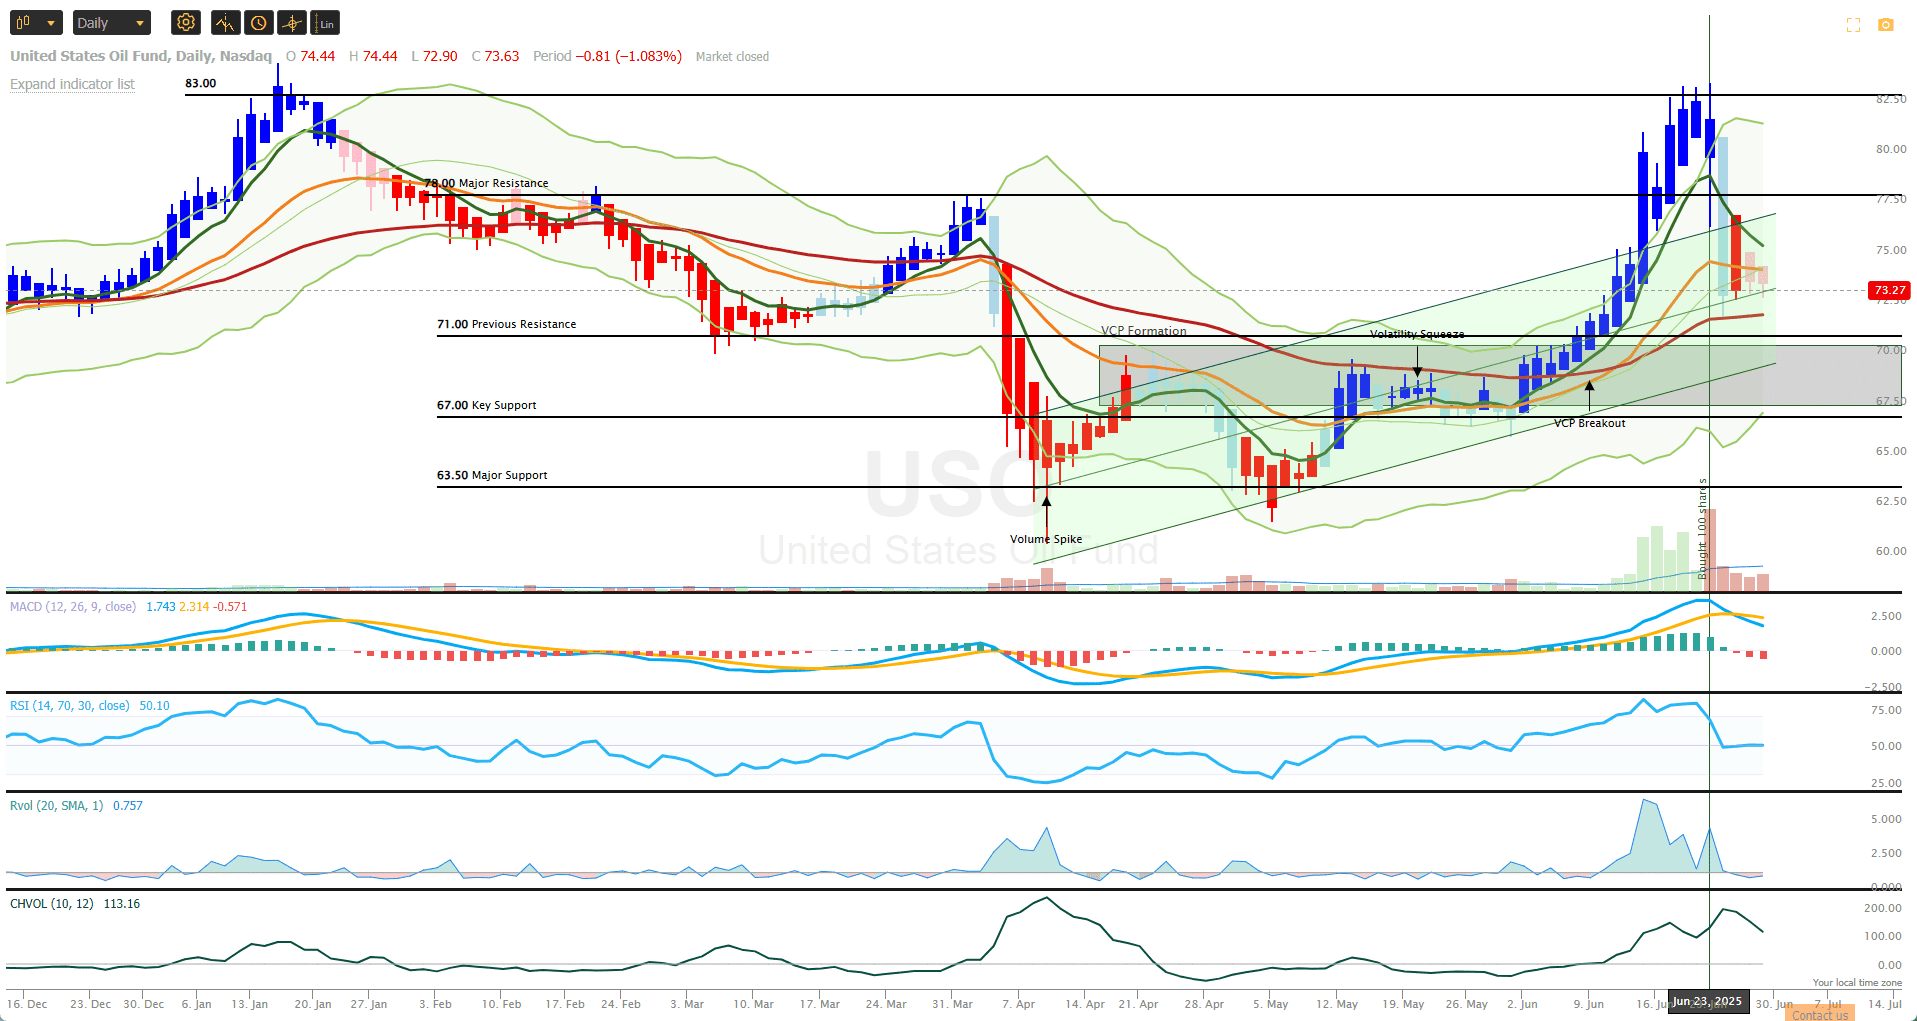
where we see that, despite the ~10% drop since shares were purchased and current price is below the 8- and 21-period EMAs, there is no crossing of the EMA lines and the EMAs are still stacked bullishly. Also, although both the MACD and RSI indicators turned bearish on Wednesday (red candle) the RSI has since turned bullish, giving mixed signals from there 2 indicators. In addition, volume in the down move has not been higher than average, so this may be a normal healthy pullback after a strong bullish move through early June. We will wait to see what happens from here.
The only other issue here was in the allocation of funds that I assigned to USO. Last week I commented that the calculated number of share to be purchased to restrict USO to the targeted 2% volatility was only 40-50 shares, but that this would not allow me to sell Calls against the position. I chose to buy 100 shares so that I could sell the Calls – but this doubled my risk (volatility) to 4% of total portfolio value. As it turned out this was not a great decision 🙂 despite the fact that I was able to sell the Options to, at least partially, offset the loss on the shares.
If we look at the current recommendations for fund allocations to maintain a 2% volatility risk target for all funds, the picture looks like this:
 where we can see that, for USO, I am well over the calculated limit to maintain my chosen 2% volatility risk level. I will continue to watch USO over the next few days to decide whether I should sell up to 75 of the 100 shares currently held. If we see a bounce, no big problem, but, if we see continued weakness, I might at least consider reducing holdings, so as to maintain my volatility/risk limits, even if I am not seeing Sell signals for the Fund.
Other highlighted cells in the above screenshot show below calculated allocations to SPLG and IAU – but not far enough off target for me to get too worried about – these number can change quite dramatically as market conditions change and, based on the first 6 weeks of watching these gyrations a 25% deviation is not likely to make a significant difference to performance/returns. There has been a little above-average volatility in EEM recently, so I will keep a low-level watch on this and may consider selling 100 shares if volatility continues to rise (rising volatility generally suggests weakening prices).
Rutherford Risk Management:
The current situation regarding hedged positions in 6 of the 7 ETFs held in the portfolio looks like this:
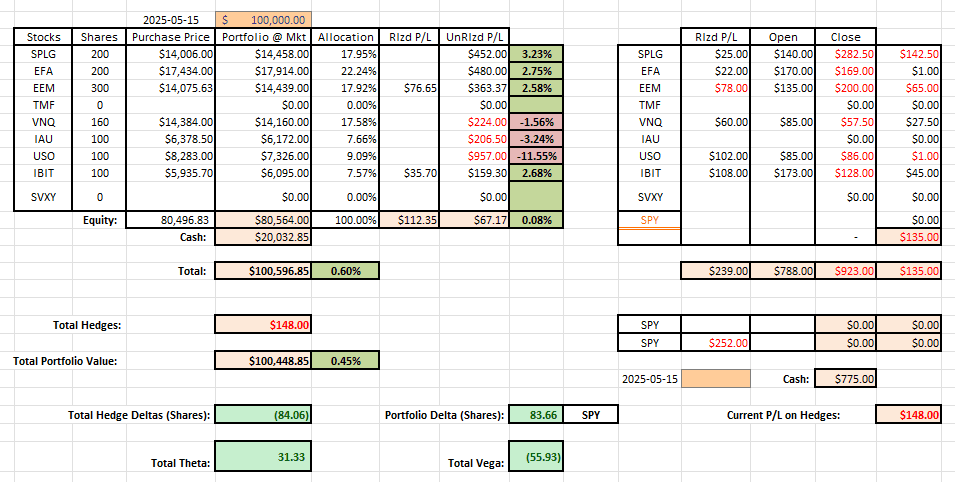
Realized profits (i.e. closed positions) from Call Options sold against portfolio holdings is presently $239, while an additional $788 credits has been collected from Options presently still open. At the present time it would cost me $923 to close these positions for a $135 loss – but time is our friend here and time leads to decay of premium value – at the present time sitting at $31 per day. Although USO collapsed only a few hours after I had purchased the shares, price dropped so quickly that I was able to realize $108 profit from the initial Options sold and rolling down to sell at a lower strike price to bring in another $85 ($193 total hedge against the drop in share value).
The holdings in the Core Darwin portfolio are equivalent to holding ~84 shares of SPY and these are presently ~100% hedged by the Options sold, In the Option world this is known as Delta hedging with the current portfolio basically “Delta Neutral” – or not very sensitive to price movement – we just wait for the decay in time premium to generate “alpha” to a static market condition.
The impact of this combination of strategies for the Rutherford-Darwin Portfolio is reflected in the following equity performance graph:
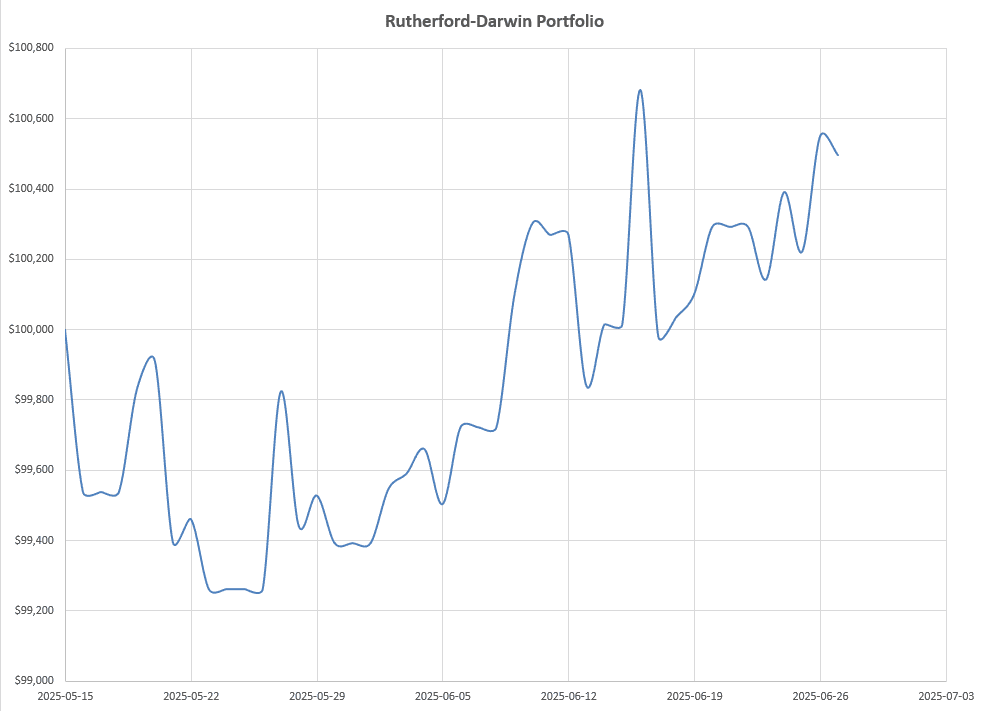 that is continuing to maintain an amazingly low 4.05% volatility level. There is not much point in calculating a Sharp reward/risk ratio at this point but, if we stay anywhere near this level of smoothness we should see a Sharp ratio of greater than 1.0 (reward/risk)
Summary:
Portfolio performing nicely and no immediate adjustments planned – but close monitoring called for over the next week.
Discover more from ITA Wealth Management
Subscribe to get the latest posts sent to your email.
Leave a Comment or Question