
Fall stage of Love-in-a-mist. Photography using Focus Stacking.
Before diving into the update of the McClintock, readers need to know that Yahoo has shut the door on free downloading of data. If you are a Kipling spreadsheet user, Tiingo Adj. Price is still working so use that option to download price data until further notice.
And now for the update of this small Sector BPI portfolio. By the end of the week no sectors were in the oversold zone so no sector ETFs are recommended for purchase. When this is the situation we look to VTI and VOO for investment opportunities as we don’t want the market to walk away to the upside. If history is any guide, this is unlikely to happen in September, one of the less stellar months for equity investments.
McClintock currently holds over $11,000 in cash so I will place numerous limit orders for both VTI and VOO using limit orders between 1% and 10% below the current price for each of the two ETFs. I would not use multiple limit orders if there were commission charges, but commissions are no longer an issue.
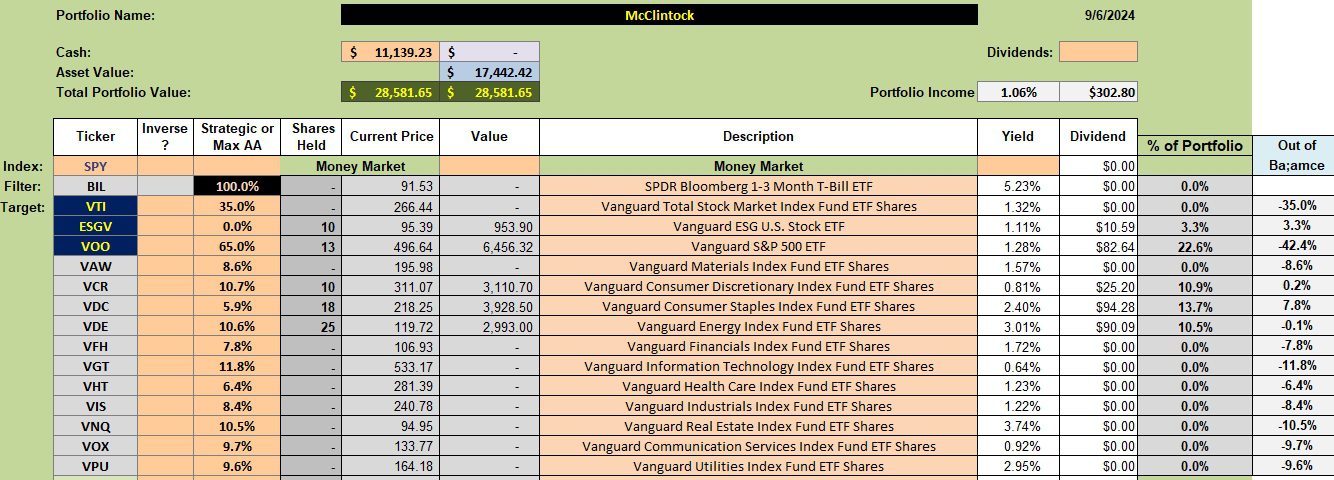
McClintock Security Holdings
Below is the current investment quiver for the McClintock and the “investment arrows.” To simplify the equity options, I have a limit order in to sell all shares of ESGV. When that occurs I will purge that ETF from the list and concentrate on VTI and VOO.
- The word “balance” will be corrected next review.
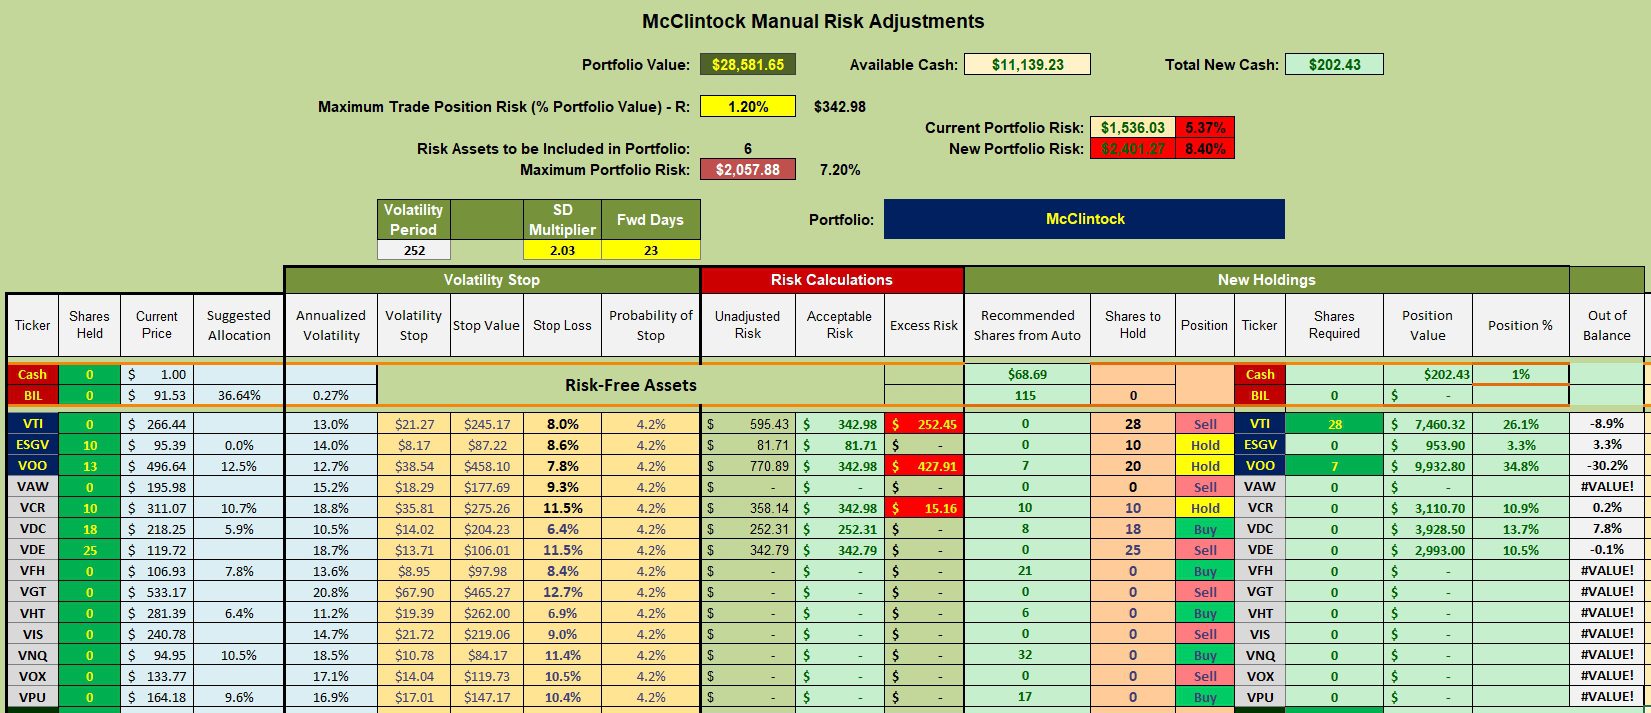
McClintock Manual Risk Adjustments
The only change coming to the McClintock is to add shares of VTI and VOO.
When working with Sector BPI portfolios we don’t pay attention to the Buy-Hold-Sell recommendations that come out of the Kipling SS. We are directed to buy and sell based on Bullish Percent Indicator data. This is an entirely different way of evaluating the sectors of the U.S. Equities market.
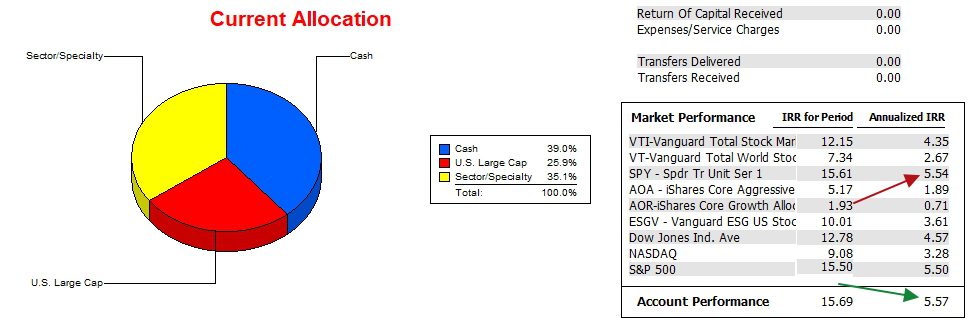
McClintock Performance Data
Since 12/31/2021 the McClintock is in a dead heat with the SPY benchmark. Of the other possible benchmarks, only VTI comes close.
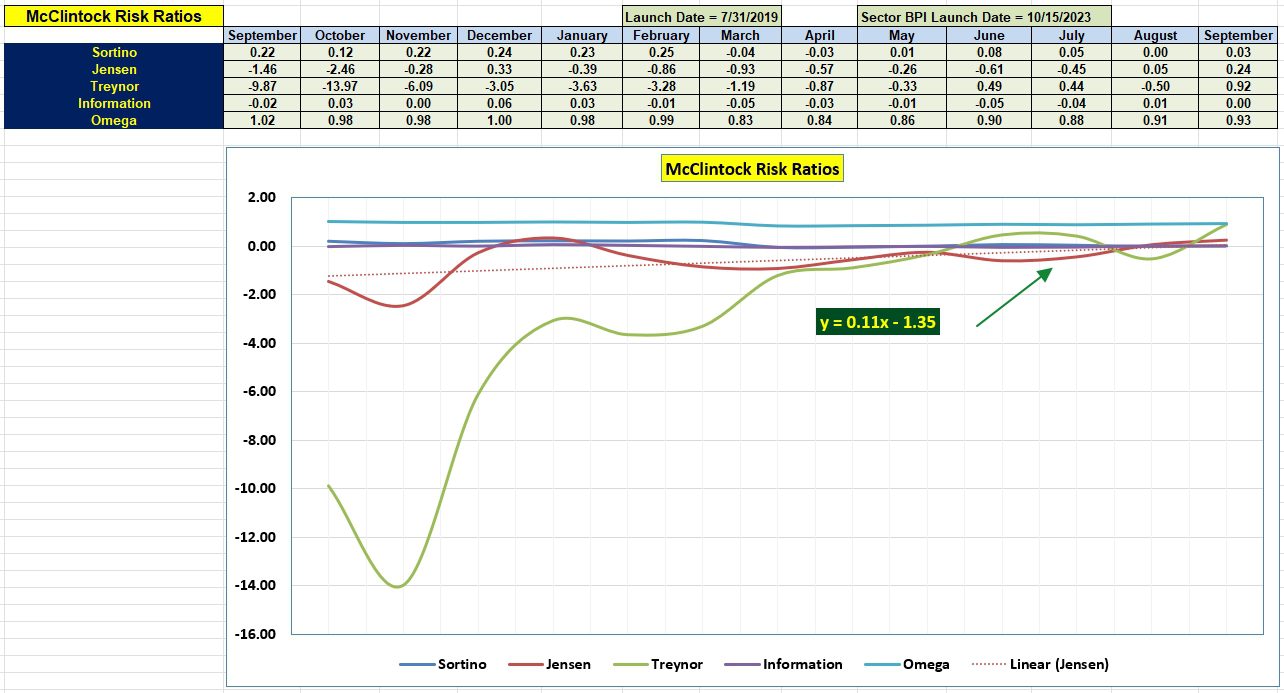
McClintock Risk Ratios
If you peruse all the risk data over this past year, all values are quite close to zero. There have been few wild swings. While it is still early in September, it is encouraging to see the upward movement in the Jensen since August. Another positive metric is the positive slope for the Jensen Performance Index.
Later this week the Pauling and Copernicus portfolios are scheduled for review. Let’s hope Tiingo data source continues to function.
Discover more from ITA Wealth Management
Subscribe to get the latest posts sent to your email.
The Energy sector is back down into the oversold zone so I am placing limit orders for VDE in Sector BPI portfolios that are not quite up to the recommended percentage.
If working with the Kipling spreadsheet use the Tiingo Adj. Price option to update the portfolio.
Lowell