
Vineyard near Sherwood, Oregon.
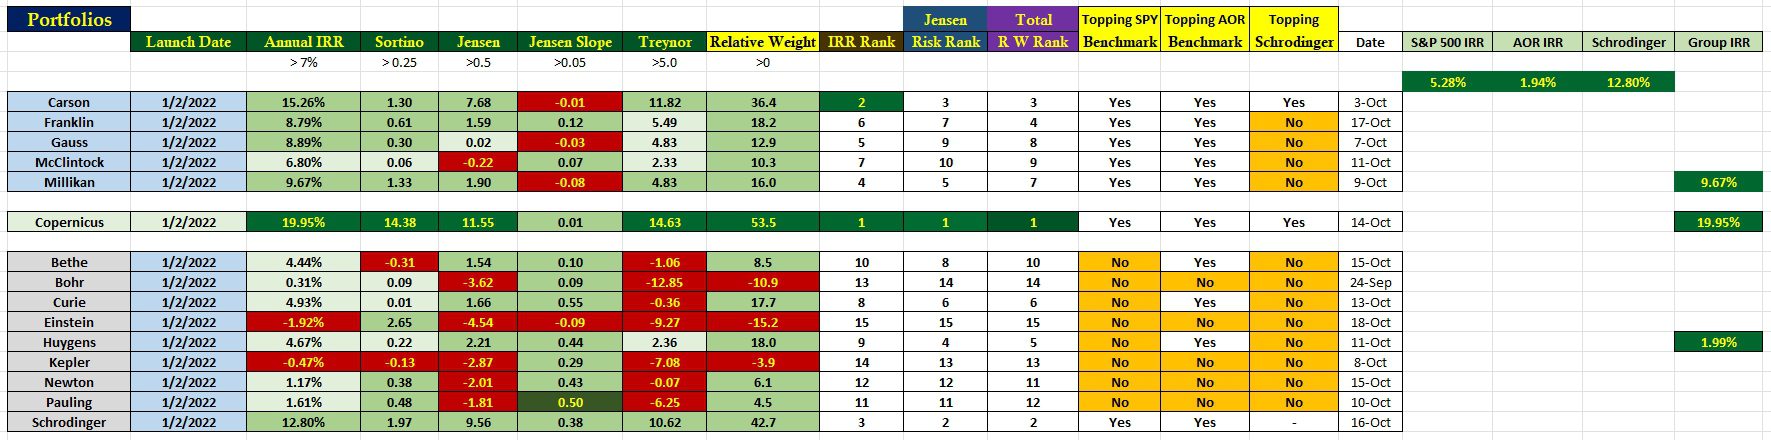
Approximately every month to six weeks I post relative performance data for the fifteen (15) portfolios I track here on the ITA blog. The Annual IRR data found in the third column from the left is accurate as of 18/18/2024. All other data is current as of the date found in the fifth column from the right. Four risk factors are worked into the ranking which I call the Relative Weight Rank.
Since the last performance blog post the Schrodinger moved from #3 to #2 in total performance.
Portfolios with the blue background are the five Sector BPI portfolios. The benchmark for those five is the S&P 500. Portfolios with the gray background use AOR as the benchmark as these portfolio carry a significant percentage in bonds and treasuries so growth is limited.
The far right-hand column shows the annualized IRR as a group. As a group the Sector BPI portfolios are outperforming their benchmark. The same is true for the Asset Allocation portfolios, powered primarily by the performance of the Schrodinger.
Questions and comments are welcome if you need further explanations related to this table.
Discover more from ITA Wealth Management
Subscribe to get the latest posts sent to your email.
The Schrodinger’s Jensen Risk Rank, at #2, is impressive. I appreciate this update.
Lee,
Yes, it is impressive and much better than I anticipated when I first began using Schwab’s Robo Advisor or Intelligent Portfolio model.
I think I mentioned this before, but if the account exceeds $50,000 Schwab will tax manage the account.
Lowell