
Tiger Lilies
Another month has passed and more new highs in the US Equity markets despite all the uncertainty:
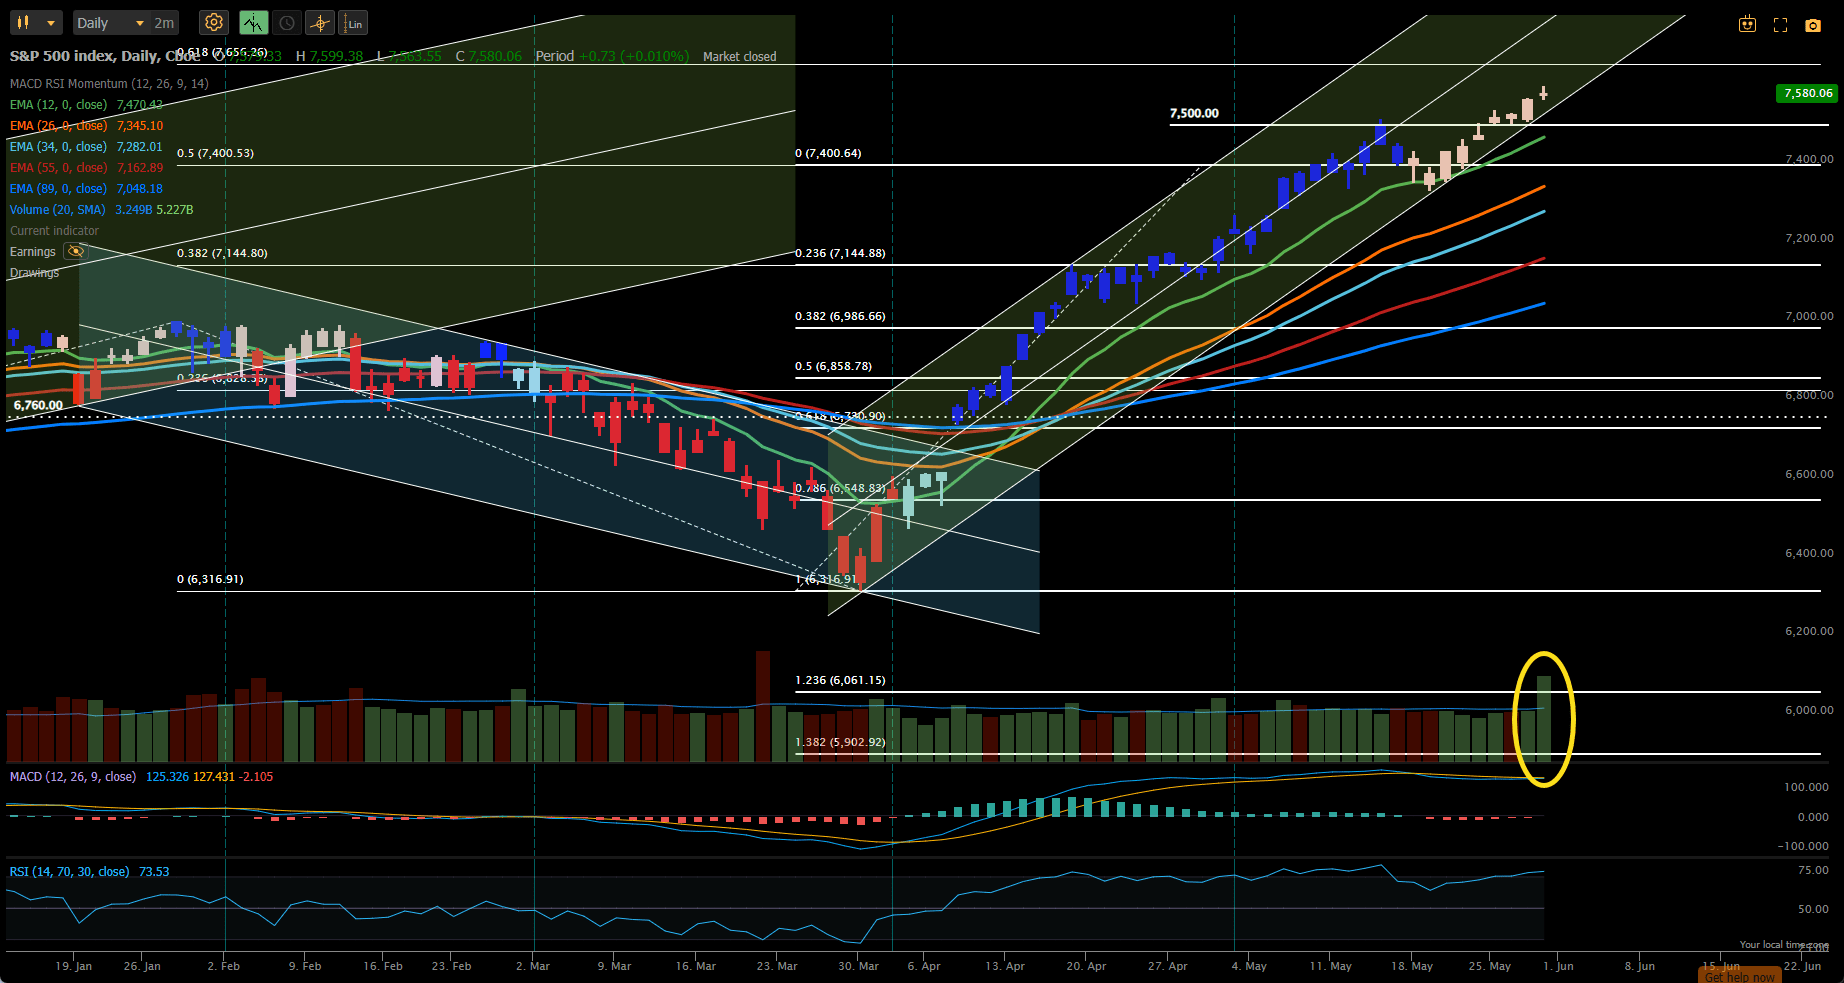 Despite the pullback from resistance at 7500 in the SPX (S&P 500 Index), this week saw a retest and breakthrough of that resistance and we are now headed towards ~7650, or the 1.618 Fibonacci extension level where we might see new resistance. Look at that volume on Friday following the announcement of a possible resolution to the conflicts in the Middle East. We’ll wait to see whether this is indeed close to a resolution or simply more propaganda, hype and/or “fake” news.
Although US markets closed out ~1.5% higher than last week’s close they did not keep up with International markets:
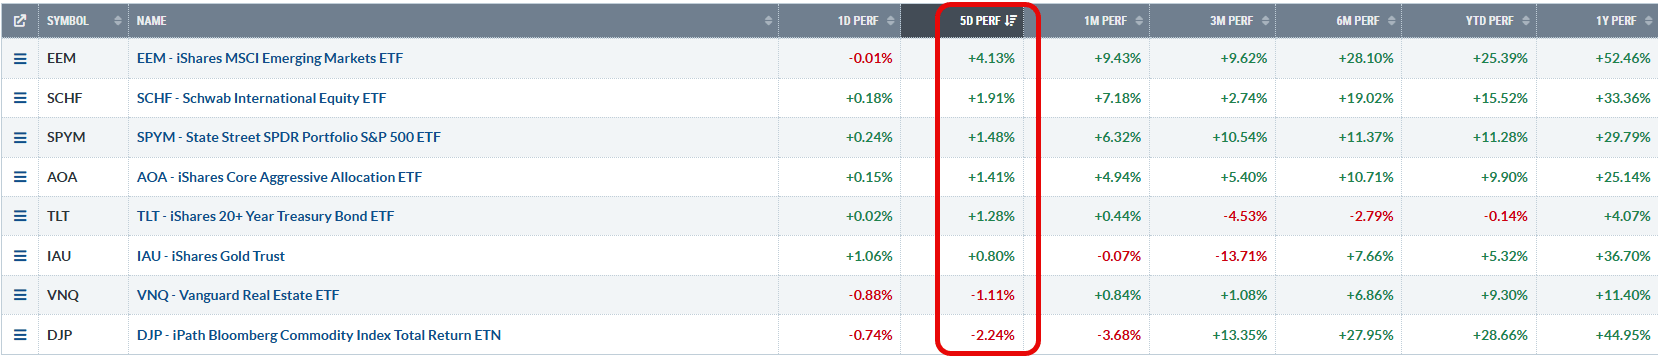 with Emerging Markets closing ~3 times higher. Commodities (led by Oil) again lost out.
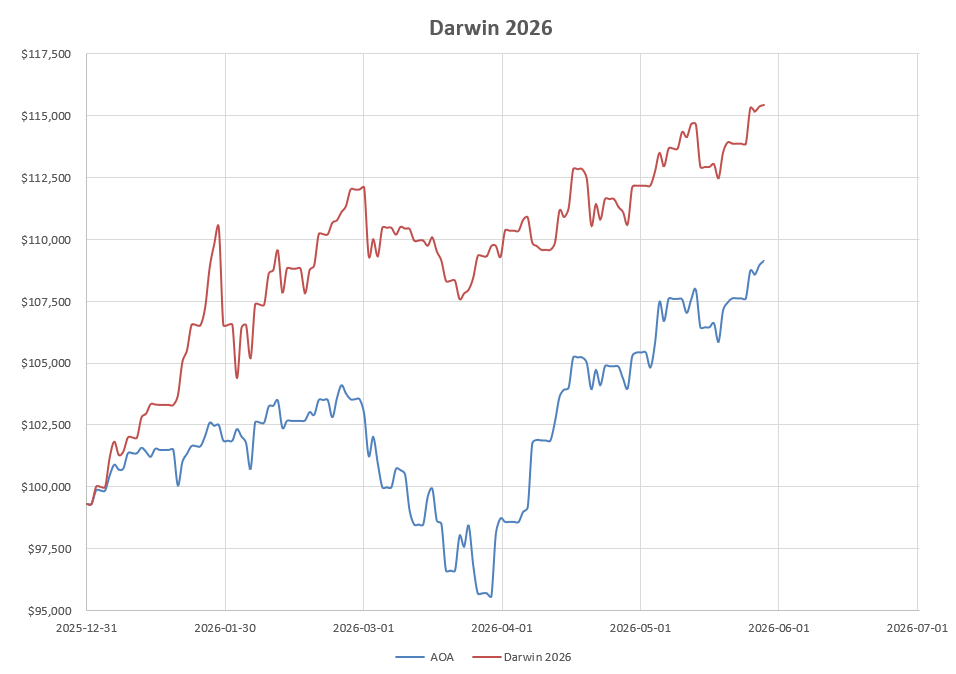
Although not fully invested, the Darwin Portfolio just about held it’s own compared to the benchmark AOA Fund:
 with the only adjustments/trades this week coming in EEM (Emerging Markets) – [red box]:
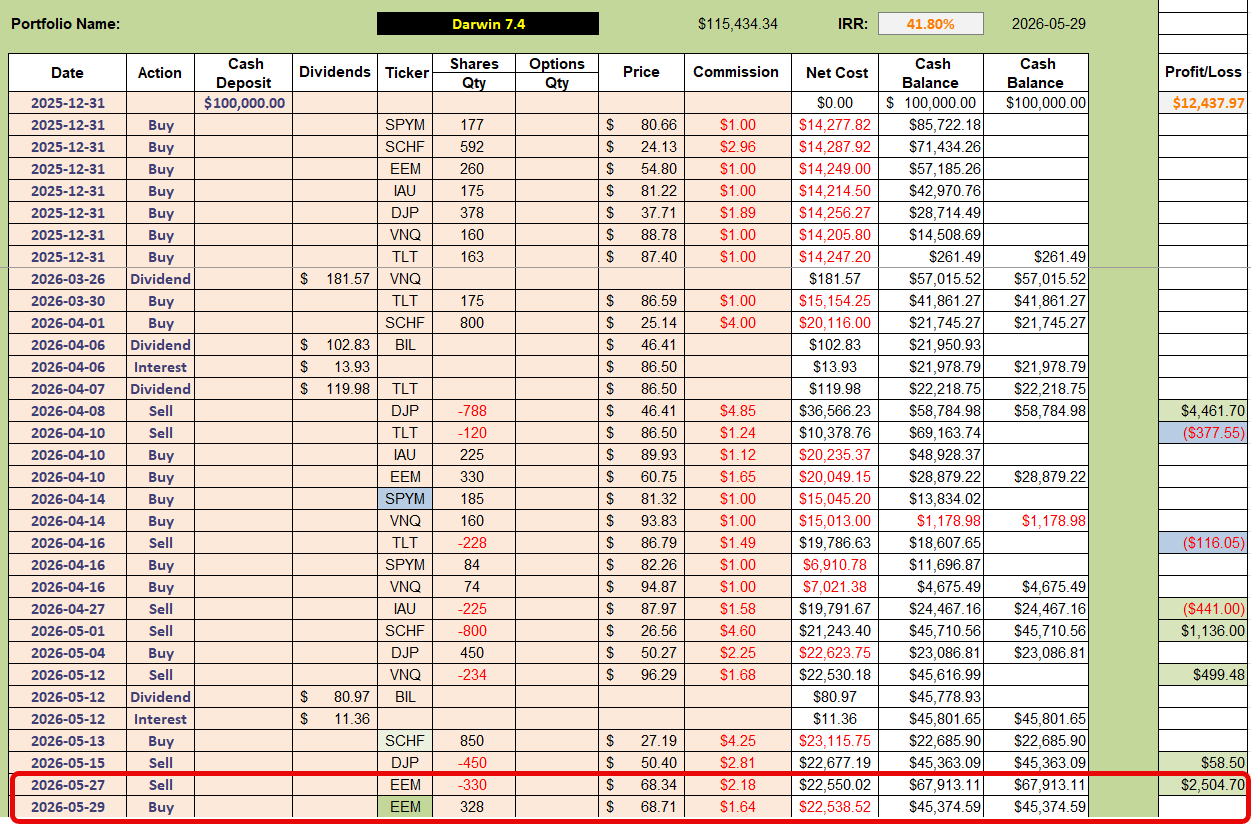 I got whipsawed a bit here by closing my position on Wednesday (locking in $2,500 in profits) and having to re-open on Friday as the markets again ran higher. Although this is a little annoying/frustrating it happens from time to time and there’s no shame in taking a nice profit, re-considering the options, and starting again if things look positive.
Let’s take a look at the momentum/acceleration graphs to see why I made these decisions:
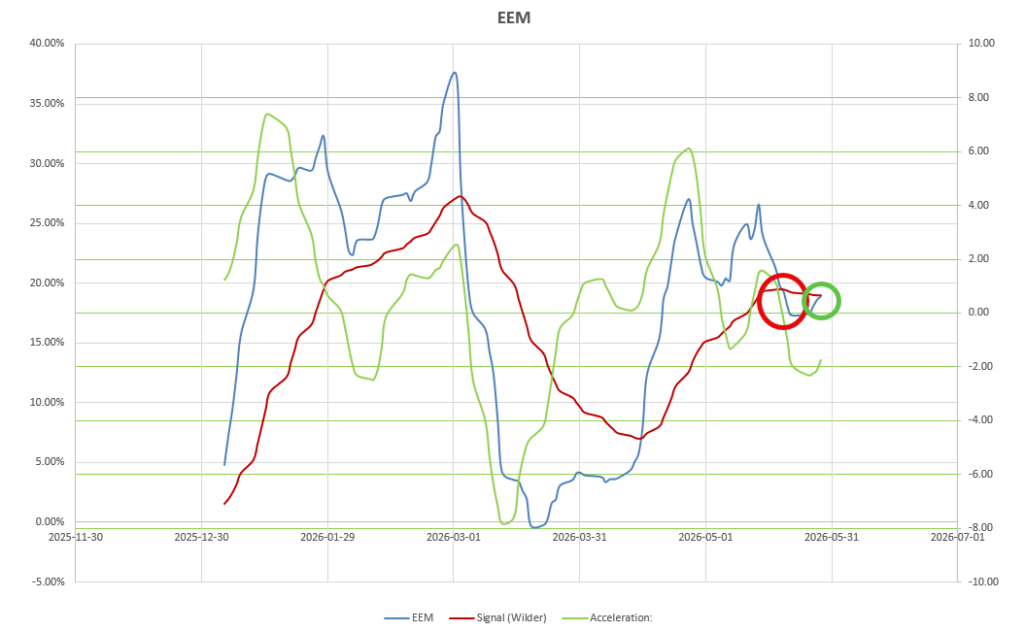 … at the beginning of the week, acceleration (green line) fell into negative territory, closely followed by declining momentum (blue line) crossing below it’s 14-period Wilder Moving Average. This is where I sold. On Friday, momentum turned around and (just) crossed back above it’s moving average and, with the bullishness in the markets, I decided to get back in. Acceleration is still in negative territory but, with a ~one week lag, this should confirm next week if the market remains bullish.
With a little help from Claude I am building a new workbook and the following is a chart from the new file showing the relative strengths, in terms of intermediate time-frame momentum (55 days or ~3 months), for the ETFs in the Darwin “quiver”:
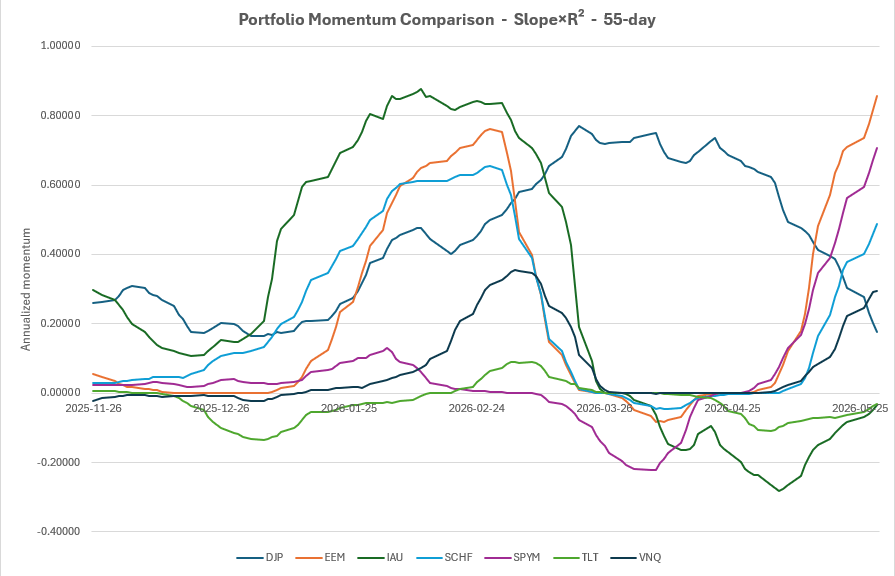
As can be seen, EEM is clearly leading the way with US and Developed Markets not too far behand. As can be seen, Commodities – that led the way earlier in the year – while, still in positive territory (over this time frame) are on a sharp decline and are not currently held in the portfolio.
The above chart/graphs helped me make the decision to re-enter and is consistent with recommendations in the current workbook where EEM has flipped back to a Momentum Buy signal:
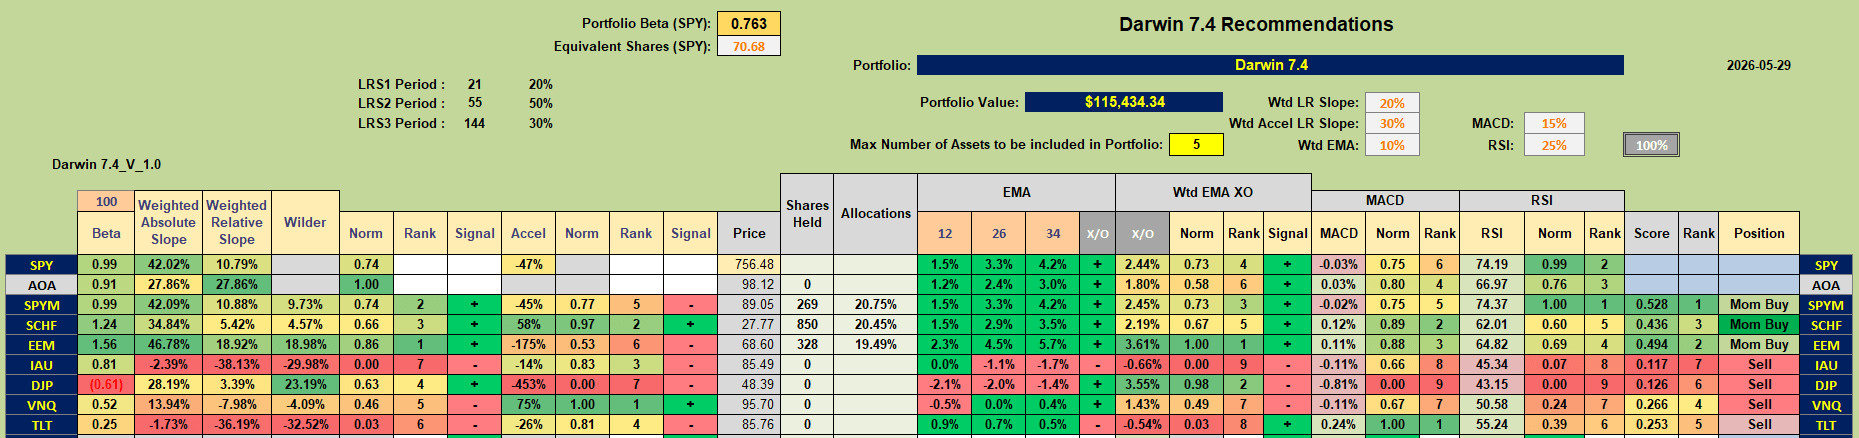 I am still only ~60% invested – so not meeting my goal of being 100% invested – but these are nervous times and we have to balance our FOMO with our YOLO 🙂
VNQ (US Real Estate) looks like it might be worth watching:
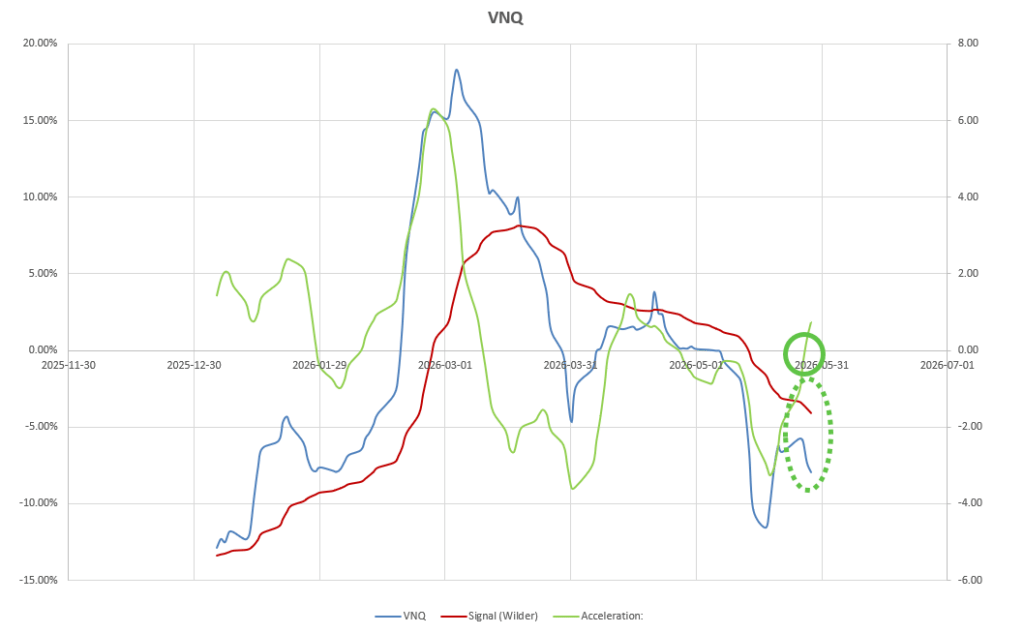 Acceleration has just turned positive – so I will be looking for momentum (blue line) to cross above it’s Wilder Moving Average (brown line) before opening a position.
In my new workbook I am working on a new algorithm that might allow me to leg into/out-of positions and, maybe, make it a little easier to retain higher allocations. Unfortunately, my YOLO life is wearing a bit thin so I will probably need to establish a maximum holding, with which I am comfortable, for each ETF. At the moment, because there is diversity in and between the ETFs, I can live with 25% per ETF (maybe even 30%) – but I get a bit nervous beyond that (and I’m pretty aggressive).
Discover more from ITA Wealth Management
Subscribe to get the latest posts sent to your email.
Leave a Comment or Question