
Thistle racing on Willamette River with one boat showing an hour glass spinnaker. Disaster as the will cost the race.
There are three ITA portfolios I track that use the Asset Allocation model. The oldest is the Schrodinger and new to the game are the Pauling and Huygens. These latter two were launched in April of this year so there is little history. This morning I am updating the Huygens as a few shares of VEA and VWO were added since the last review.
All three portfolios are balanced portfolios and differ considerably from the Copernicus which focuses strictly on a few U.S. Equity Exchange Traded Funds.
Huygens Asset Allocation Securities
The third column from the left specifies the percentage of each ETF to be invested and over on the far right is the Out of Balance data. The goal is to keep each asset class within + or – 0.5%. Currently, VOO is oversubscribed while VEA and SHY are under represented.

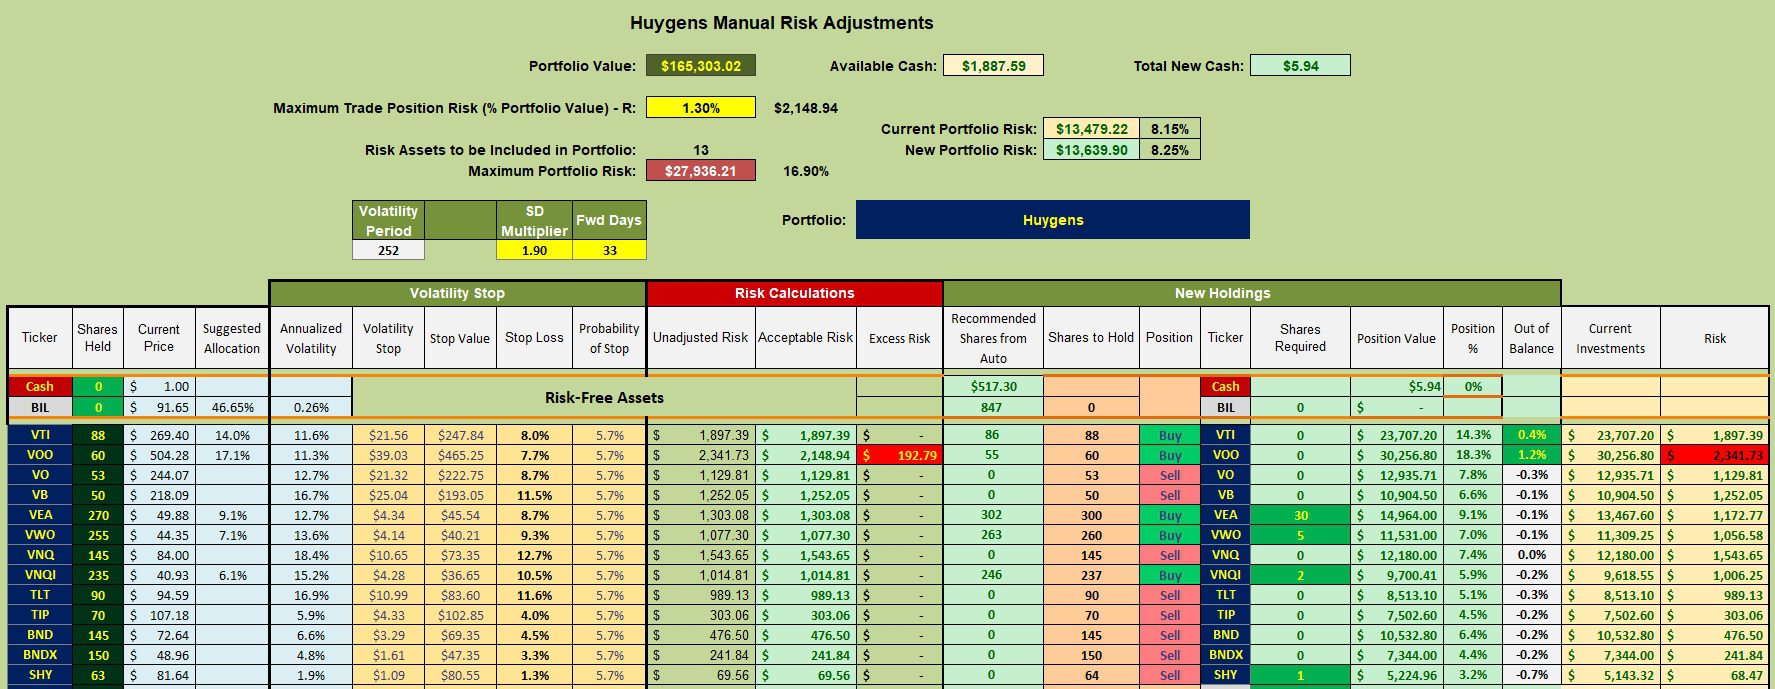
Huygens Manual Risk Adjustments
Given the current amount of cash it is not possible to bring the Huygens into balance for every asset class without selling shares of VOO. With the market humming along as it is, I’m reluctant to sell shares of VOO. Instead, I’ll wait for second quarter dividends and then first work to bring VEA into balance, followed by VWO, VNQI, and SHY in that order. It may take a few quarters to bring the entire portfolio into balance.
The two possible asset classes not included in the Huygens are: Commodities and Gold. Commodities creates extra work when filling out taxes and Gold pays no dividends and has a poor long-term track record when it comes to performance. This is why I left those two asset classes off the list and did not include them in the investment quiver of the Huygens.
Huygens Performance Data
While the Huygens has only been using the Asset Allocation model for a few months, the following data begins on 12/31/2021. As readers can see, the portfolio lags the SHY benchmark, but it is matching AOA and outperforming AOR.

Huygens Risk Ratios
Pay most attention to the Jensen Performance Index and the Information Ratio. One positive indicator is the positive slope of the Jensen. The slope is modest at best, but at least it is positive.

Huygens Asset Allocation Portfolio Review: 10 April 2024
Tentative Asset Allocation Model
Discover more from ITA Wealth Management
Subscribe to get the latest posts sent to your email.
Craig et al.,
Here is a quote regarding comments posted under the Schrodinger portfolio.
“Jensen’s alpha was first used as a measure in the evaluation of mutual fund managers by Michael Jensen in 1968.[2] The CAPM return is supposed to be ‘risk adjusted’, which means it takes account of the relative riskiness of the asset.
This is based on the concept that riskier assets should have higher expected returns than less risky assets. If an asset’s return is even higher than the risk adjusted return, that asset is said to have “positive alpha” or “abnormal returns”. Investors are constantly seeking investments that have higher alpha.
Since Eugene Fama, many academics believe financial markets are too efficient to allow for repeatedly earning positive Alpha, unless by chance. Nevertheless, Alpha is still widely used to evaluate mutual fund and portfolio manager performance, often in conjunction with the Sharpe ratio and the Treynor ratio.”
I much prefer the Sortino ratio to the Sharpe ratio as the Sharpe penalizes volatility to the upside, something we desire as an investor, while the Sortino ratio does not. As for the Treynor ratio, it its too dependent on the portfolio beta. This is why I favor the Jensen over the Treynor.
Lowell