
Orchids, Botanic Gardens, Singapore
Santa has left town, with US Equities, as represented by the SPX (S&P 500 Index), at all time highs:
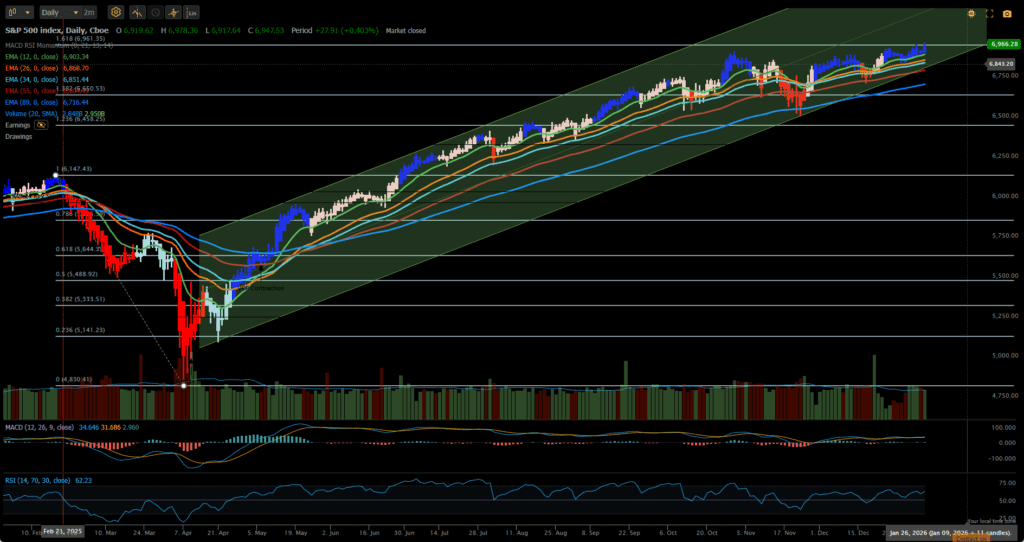
This would seem to be a critical level – at the mysterious 1.618 Fibonacci extension level and close to the psychologically important 7000 (round number) level. We remain in the strong uptrend channel that began following the ~20% “tariff correction” in April 2025 (9 months ago), with Exponential Moving Averages (EMAs) stacked favorably to confirm the bullish trend. Short-term indicators such as the Moving Average Convergence/Divergence (MACD) and Relative Strength Index (RSI) are also generating bullish signals. However, over the past ~3 months, we have been hovering/consolidating just under this “ceiling” and have tried at least 3 times to break through without success.
Despite the March-April correction, US (large Cap) equities closed the year ~19% higher than at the end of 2024:
 … and yet that was eclipsed by the 69% appreciation in Gold and 38-40% returns from Developed Market and Emerging Market equities respectively. Thus, a suitably diversified portfolio of Funds representing those markets would likely have beaten the US-only equity market – unless an investor was a good stock picker and chose to invest heavily in the AI-related industries.
Although I don’t like to hold assets that are underperforming a benchmark simply for the sake of diversification I do like to hold Funds that represent different asset classes in order to reduce volatility (risk) so as to generate acceptable risk-adjusted returns. That is my goal in managing the Darwin Portfolio:
 that comprises a “quiver” of seven ETFs representing a global diversity of major asset classes.
I reset this portfolio on 31 December 2025, with minor changes to the assets to be held in the “quiver” and the introduction of a new system for managing the portfolio that attempts to combine the benefits (and weaknesses) of both momentum/trend systems and mean reversion systems into a single model/system. I also plan to try to remain fully invested by using an equal weight fund allocation philosophy in the management of the system.
Although I do not anticipate/expect that the portfolio will hold all seven ETFs at any particular time, it so happens that, when I opened this portfolio on 31 December, all seven funds were recommended “Buys” at that time – so, I have started out being fully invested in all seven ETFs with equal weighting in fund allocation:
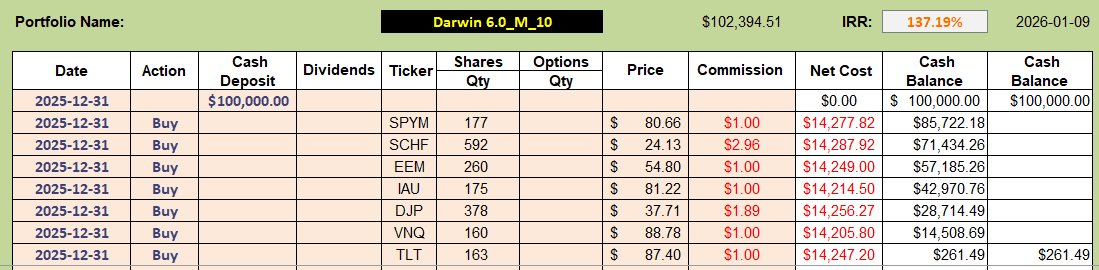 After the first week, performance looks like this:
 with a promising start in that I am slightly ahead of the benchmark AOA Fund with ~$2,400 profit since inception. I’m obviously not going to be able to keep that up – but the goal will be to try to stay ahead of the benchmark.
I have been following the changes in the spreadsheet and recommendations presently look like this:
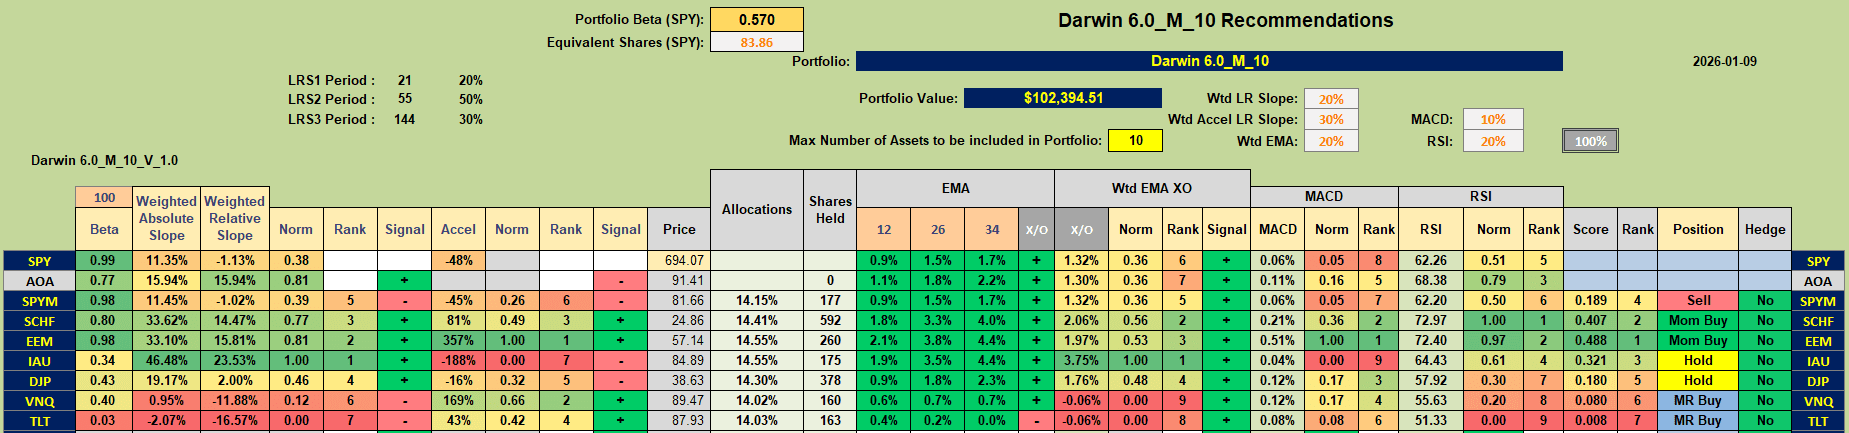 I have modified the sheet a little in that I have separated the Buy recommendations such that the momentum (Mom) and mean reversion (MR) entries are identified. Hopefully this will help me track the efficacy of both regimes and help identify conditions under which each “system” works best and, maybe, help define a filter to switch from one system to the other. Meanwhile I will run both systems simultaneously to provide another layer of diversification.
As mentioned briefly in my last post, SPYM switched from a Momentum Buy/Hold signal to a Sell signal the day after opening the position (2 January). I have been monitoring this situation that looks like this:
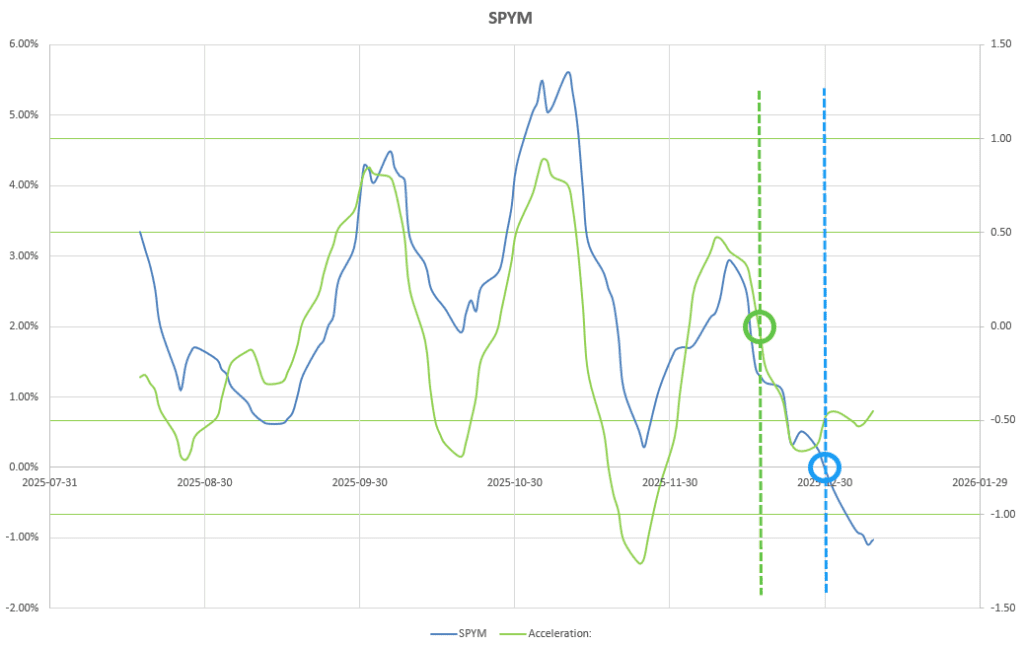 where we can see that, in the first half of December (ahead of the dashed green vertical line), both momentum and acceleration were in positive territory (Momentum Buy signal). Then, in mid December, acceleration turned negative – that would trigger a Hold signal (if shares had previously been purchased) – after which (on 2 January) momentum crossed the horizontal axis (dashed blue vertical line) and also turned negative, thus triggering the Sell signal. Normally, I would not have been buying on 31 December (only holding a position that might have been taken earlier), however, since I was populating a new portfolio, I chose to populate the portfolio by equal weighting all seven ETFs. I am now in a discretionary position whereby I will exit/sell on confirmed signs of weakness e.g. two consecutive downward movements in both momentum and acceleration. At the moment we see a potential upturn in acceleration (the faster moving signal) with higher lows. There is also a single up-day in momentum – however, momentum has seen a lower low, so caution is appropriate and, if acceleration reverses direction, this will generate a lower high (confirming a bearish trend). Should acceleration continue upwards (bullish) and cross above the (zero) horizontal axis, this would generate a mean reversion (MR Buy) Buy signal. I hope this helps explain how I am reading/interpreting these movements to make discretionary decisions at this point. Once we are well into using the system there should be less need to make discretionary decisions.
Discover more from ITA Wealth Management
Subscribe to get the latest posts sent to your email.
I have sold my 163 share holding in TLT on a Sell signal. This is a fast reversal from a Mean Reversion Buy entry but the trade still resulted in a small $57 profit.
Today I finally decided to sell my 177 shares in SPYM. This was a Momentum Buy entry position (positive momentum and acceleration) and was closed for a small ~$46 profit.