Ruins in Turkey
Welcome to the revised version of the Huygens Asset Allocation portfolio. There is a possibility the management of this portfolio will be taken over by its owner. To make the portfolio easier to manage I’ve set up an Asset Allocation model, quite similar to the Pauling II (soon to go back to the original name, Pauling). The management process is explained below.
Today’s market action puts to the test a portfolio such as the Huygens as non-equity ETFs should withstand, to some degree, the drop in U.S. Equities.
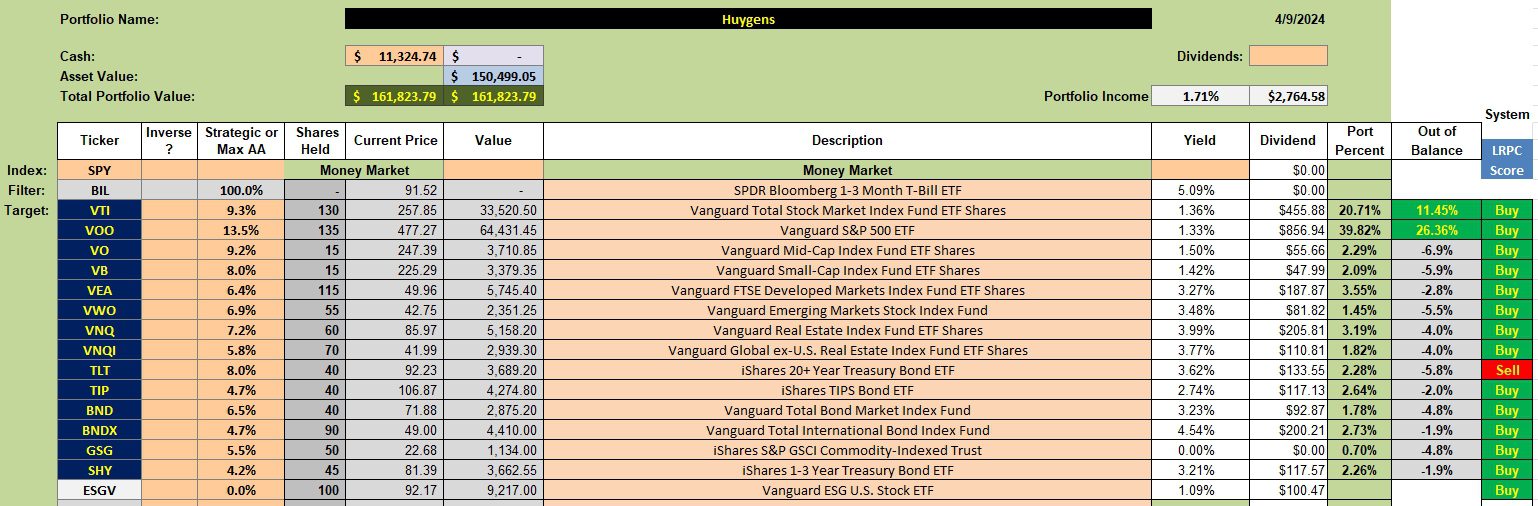
Huygens Asset Allocation Portfolio
Check out the new investment quiver. ESGV will eventually be sold out of the Huygens as U.S. Equities are covered by VTI, VOO, VO, and VB.
The Strategic or Max AA percentages (column 3 from the left) are calculated based on the three-year volatility percentage. However, I’ve adjusted the percentages slightly.
As you can see from the Out of Balance column over on the right that portfolio is not in balance. Adjustments will occur over the next few weeks to months as limit orders and TSLOs are struck. For example, ESGV is up for sale as are shares of VTI and VOO. More on this in the next worksheet.
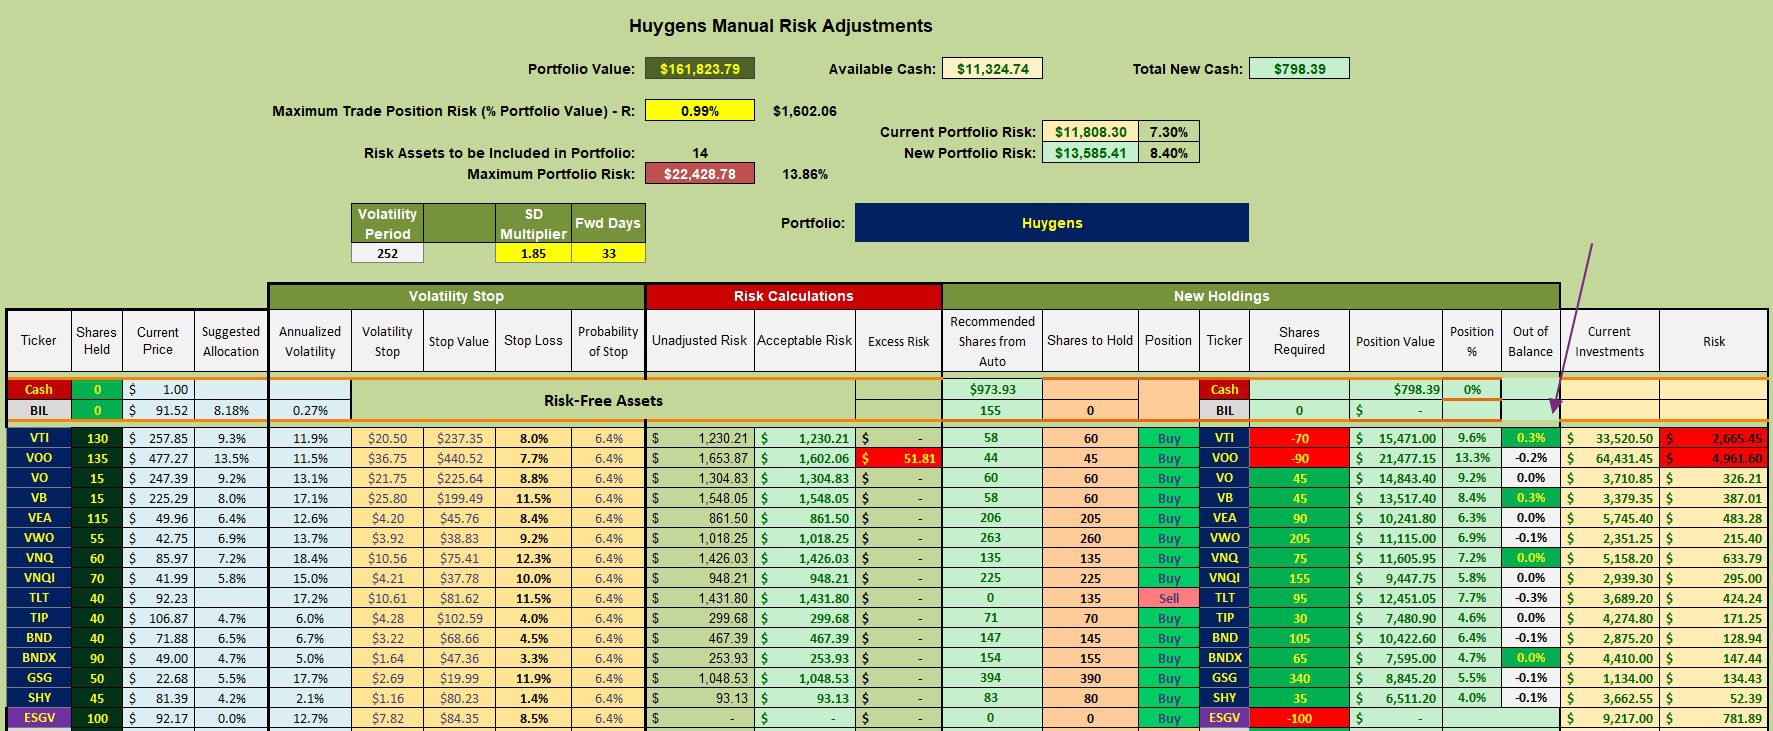
Huygens Manual Risk Adjustments
The Asset Allocation goal of the Huygens is to keep all assets within +/- 0.5% of the recommended percentage. The purple arrow points to the particular assets or ETFs that are out of balance. Limit orders to sell 70 shares of VTI, 90 shares of VOO and 100 shares of ESGV are in place. Until more cash is raised I am not able to fill the other asset classes.
The Manual Risk Adjustments worksheet (one worksheet from the Kipling SS) provides guidance as to how many shares are needed to bring the the particular ETFs into balance. Those shares are listed in the column, Shares to Hold. The Shares Required column show how many shares to purchase to bring the given asset into balance. Limit orders are in place to make all this happen.
Today’s market drop caused a number of limit orders to be struck. Once the portfolio is in balance it will be a easy to use future dividends to bring the assets (ETFs) most out of balance into balance. This is the identical approach I am using with the Pauling portfolio.
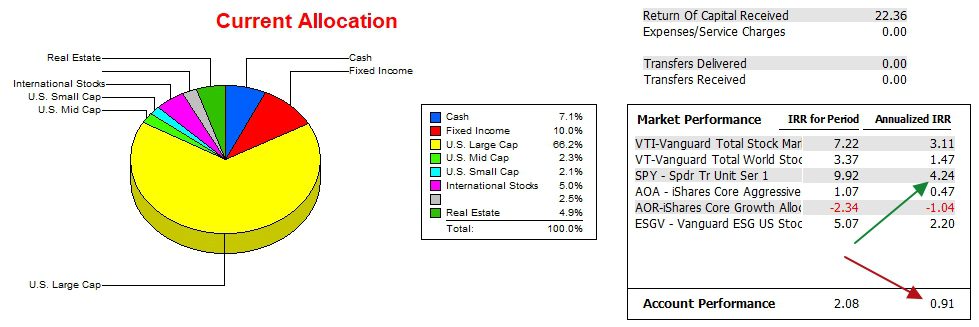
Huygens Portfolio Performance
Since 12/31/2021 the Huygens lags the SPY benchmark by over three percentage points. However, the portfolio is besting both the AOA and AOR benchmarks.
Once VTI and VOO are brought into balance the pie chart below will not show such a large percentage invested in U.S. Large-Cap stocks.
Huygens Risk Ratios
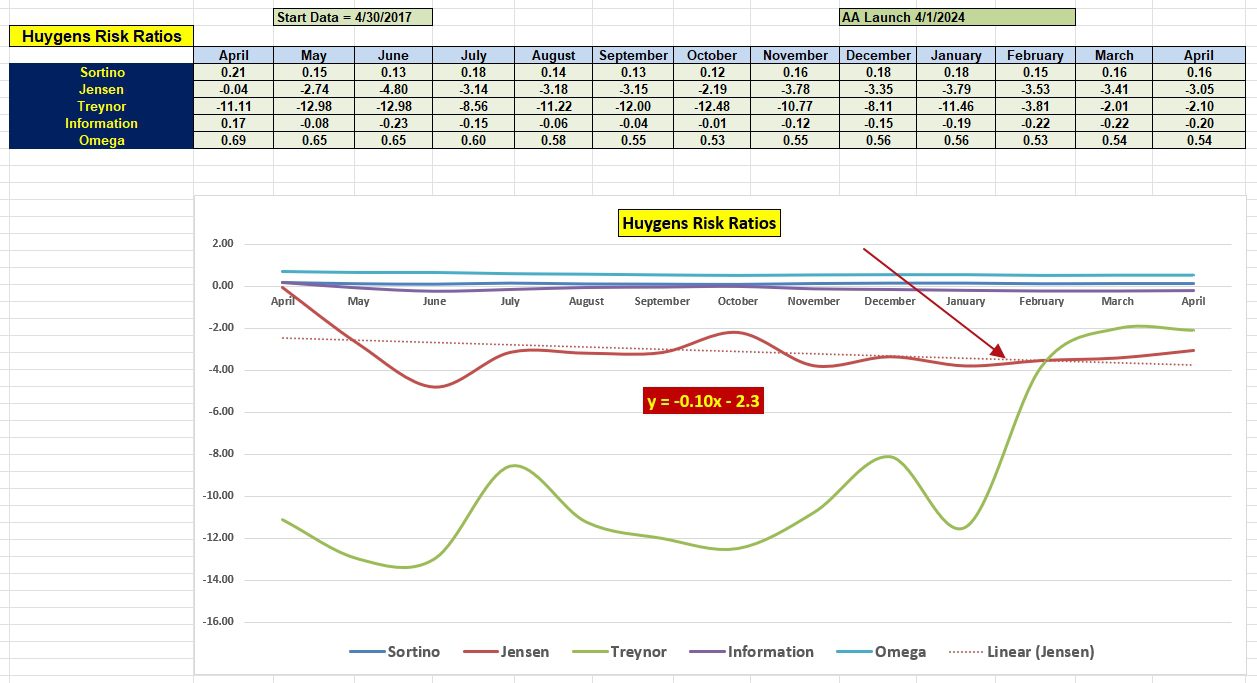
Readers will want to follow the Risk Ratio data over the next few months to see if the Asset Allocation model moves the Jensen Alpha ratio toward the zero mark. Today’s market drop did not impact the Huygens to the degree it did the Copernicus portfolio as ETFs such as TIP, BND, and BNDX are designed to resist major draw-downs.
Both the Jensen and Information Ratios improved slightly since March. Will this trend continue over the next few months? Stay tuned.
Pauling II Asset Allocation Portfolio Launch: 1 April 2024
Pauling II Update: 1 April 2024
Comments and Questions are always welcome.
Discover more from ITA Wealth Management
Subscribe to get the latest posts sent to your email.
Ephesus?
Most likely Ephesus. The camera does not have a GPS, a feature I like on the iPhone.
Lowell