
Unusual hot air balloon.
Next month ITA will celebrate its 16th birthday. To hold down the cost of operating this free blog I delete old posts in order to control storage space. This is why blogs going back more than 10 years are no longer available. Here is one of the older posts for the Franklin, the portfolio up for review this morning. Investing models have also experienced evolutionary changes over the years, another reason for culling out old and irrelevant posts.
Shortly after the market opened shares of ESGV and VTI were added to the Franklin as limit orders where struck. Additional limit orders are in place should the market decline further. As readers will see in the second data table, the Kipling spreadsheet is not calling for additional equity purchases. No sector ETFs are recommended as no sectors are oversold.
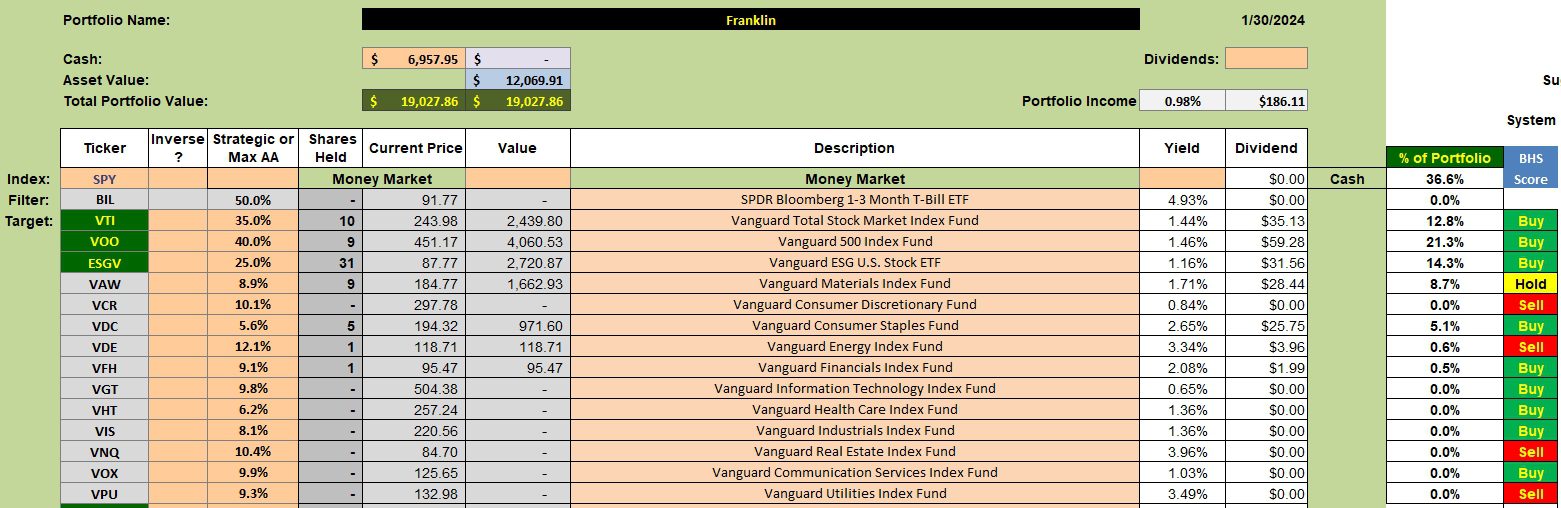
Franklin Security Holdings
Below are the current holdings within the Franklin portfolio. The largest single holding is cash and that is why numerous limit orders are in place to purchase more shares of VTI, VOO, and ESGV.
I should mention that in addition to Buy orders, I also have Trailing Stop Loss Orders (TSLOs) in place to sell all shares of VTI, VOO, and ESGV as a means of protecting capital.
Franklin Manual Risk Adjustments
Per usual, the SD Multiplier is set to 2.02 so the Stop Loss percentage for VTI is 8.0%. This is the first portfolio risk control I put in place.
The Maximum Portfolio Risk at 7.0% is a tad higher than my normal 6.0%. Columns 9 and 8 from the right show the recommended number of shares to hold for VTI, VOO, and ESGV and the shares actually held in the Franklin. The Shares to Hold are either on target or above the recommended number. No further changes are recommended so this portfolio will go into “neglect” mode until the February review.
Remember that the sector ETFs (gray background) are purchased and sold based on Bullish Percent Indicator (BPI) recommendations. The Kipling spreadsheet is not used to control sector ETFs.

Franklin Performance Data
Over the past 25 months the Franklin managed a slight margin above the SPY benchmark. Readers will see that the SPY is the most difficult benchmark of the six to exceed.

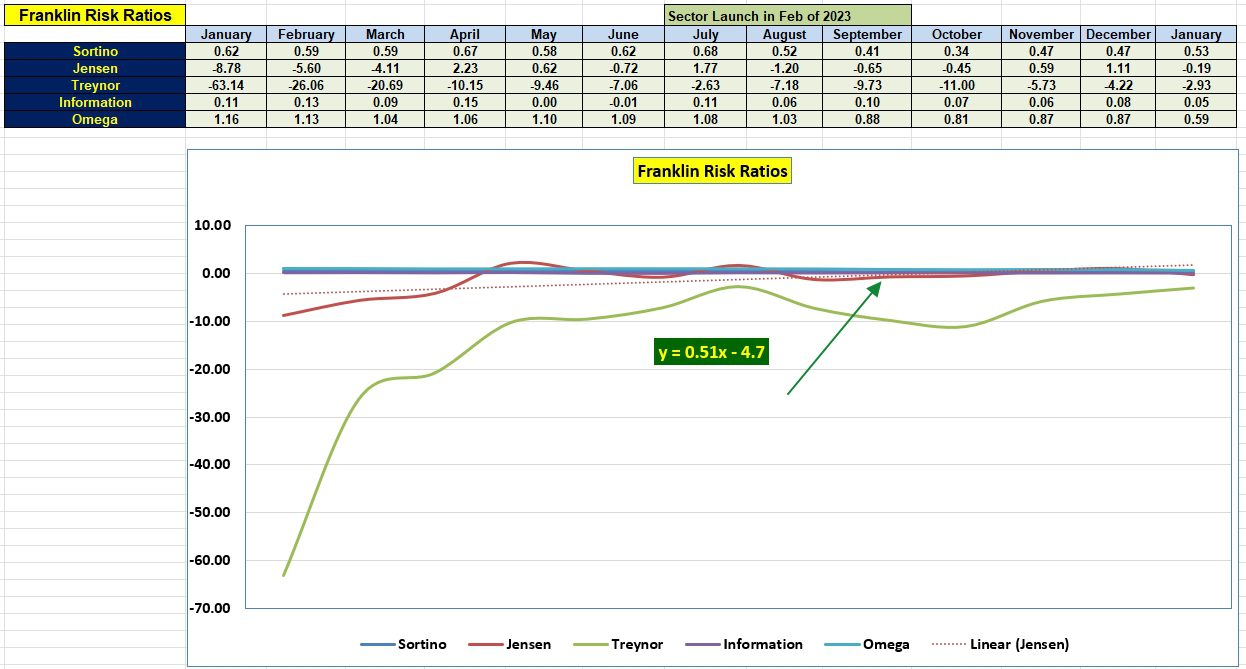
Franklin Risk Ratios
On a risk adjusted basis the Franklin not quite meeting the Jensen Alpha reference. A portfolio, if performing at a high level, should show a positive Jensen Performance Index value. The Franklin is currently negative 0.19. The good news is that the slope of the Jensen is positive and has been for some time due to the poor performance just before the portfolio was converted to the Sector BPI investing model.
The Information Ratio measures a head to head competition between the portfolio and the SPY benchmark. That value is still positive.
Questions and Comments are always welcome. Pass this link ( https://itawealth.com ) on to friends and relatives.
Discover more from ITA Wealth Management
Subscribe to get the latest posts sent to your email.
You must be logged in to post a comment.